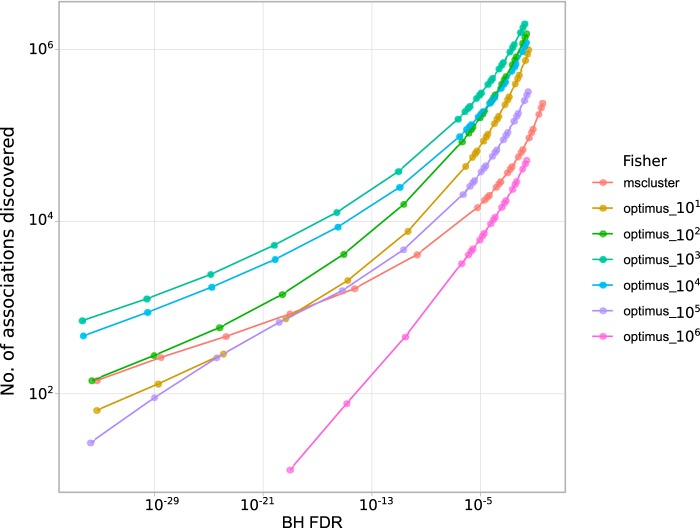
FIG 9.
Benchmarking MS-Clustering and Optimus (binarized abundance with thresholds 10, 102, …, 106) with Fisher’s exact test association. Data on the x axis represent false discovery rates estimated by the Benjamini-Hochberg procedure. Data on the y axis represent the numbers of metabolite-microbe associations discovered.

