
Figure 4.
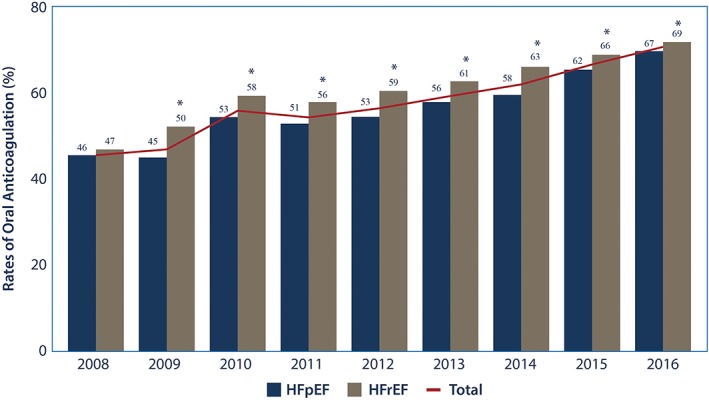
Observed rates of anticoagulation by heart failure group and year. This graphic shows the temporal trend in observed rates of anticoagulation in the congestive heart failure population (total and by heart failure group) with non‐valvular atrial fibrillation. Comparison between the observed rates of anticoagulation between the heart failure groups by year were made. *P < 0.05, HFpEF, heart failure with preserved ejection fraction; HFrEF heart failure with reduced ejection fraction