
Figure 3.
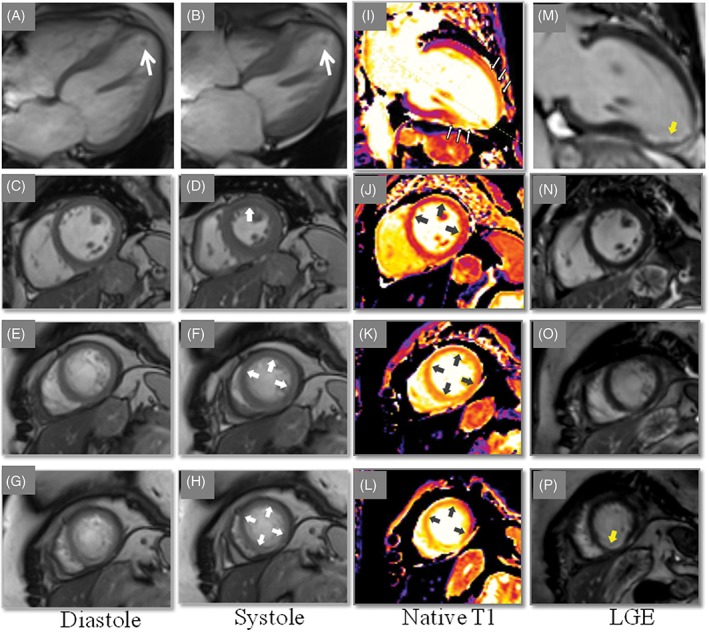
Cardiac magnetic resonance (CMR) imaging reveals mid‐apical ballooning in four chamber view (A, diastole and B, systole. A thrombus is seen in the apical part of the left ventricle (A and B, white arrows). Mid‐ and apical short‐axis end diastolic‐ and systolic images show regional hypokinesia (C, D, E, F, G, and H, white arrows). Native T1, Modified Look‐Locker Inversion recovery (MOLLI), T1 map demonstrated diffusely increased T1 values (1422‐1560 ms) in the mid‐ and apical region of left ventricular (LV) wall (gray arrows) indicating edema in these segments (I, J, K, and L). on late gadolinium enhancement (LGE) imaging, no evidence of focal LGE in the hypokinetic segments (M, N, and O) apart from the sub‐endocardial infarction seen in the apical inferior wall (P, yellow arrow)