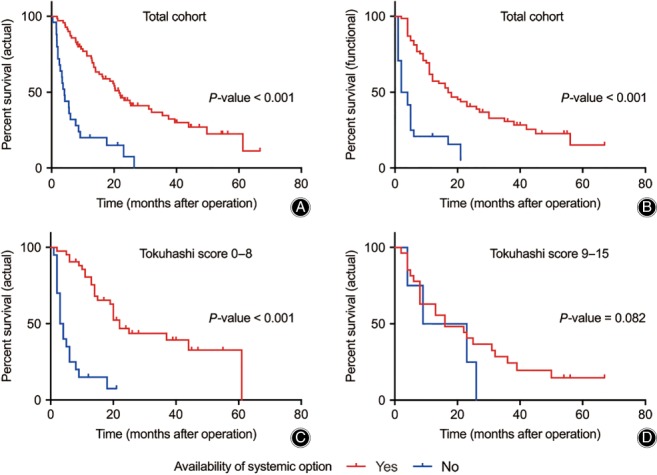
Figure 2.

Survival curves for actual and functional survival stratified by remaining systemic treatment options. (A) Curve for actual survival of total cohort. (B) Curve for functional survival for total cohort. (C) Curve for actual survival of the patients with Tokuhashi score of 0–8. (D) Curve for actual survival of the patients with Tokuhashi score of 9–11 and 12–15 combined. (All P‐values for the Kaplan–Meier curves are derived from log‐rank test).
