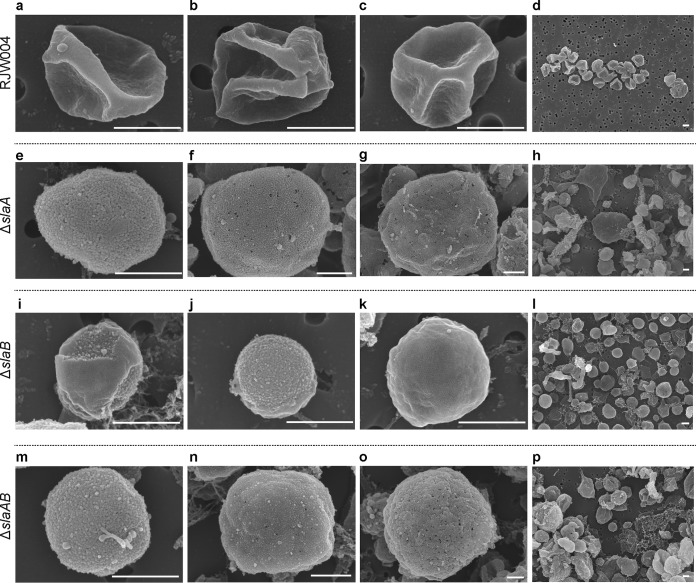
FIG 1.
SEM analysis of wild-type RJW004 and S-layer gene knockout strains. Representative scanning electron micrographs show the wild-type cell with intact outermost layer (a to c), ΔslaA mutant cell with no outermost layer (e to g), ΔslaB mutant cell with partial (i), no (j), and intact (k) outermost layers, and ΔslaAB mutant cell with no S-layer (m to o). Overview SEM images (d, h, l, and p) show the varied cell morphologies, as indicated. Scale bar, 500 nm. Additional SEM images are provided in Fig. S2 (available at FigShare [https://doi.org/10.6084/m9.figshare.8285423]).

