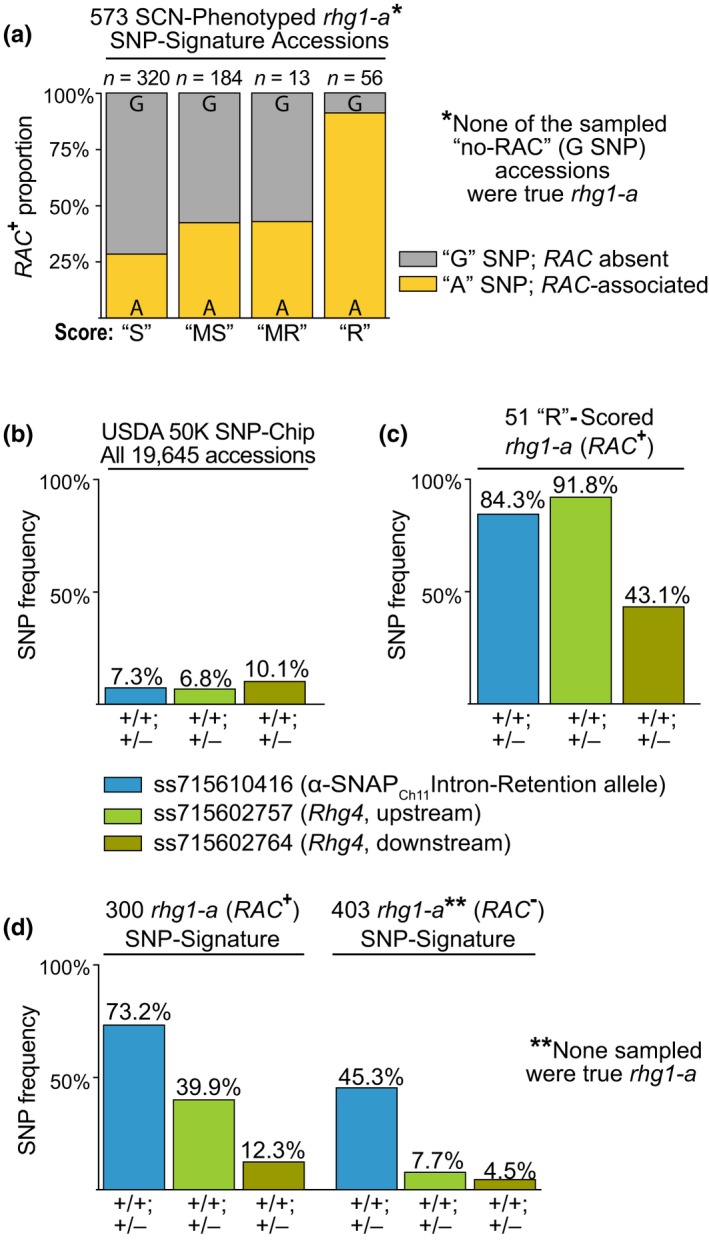
Figure 4.

RAC presence correlates with a stronger SCN‐resistance profile and the co‐presence of other loci that augment rhg1‐a resistance. (a) Proportion of RAC + (ss715606985 A SNP) versus RAC ‐ (G SNP) accessions among 573 SCN‐phenotyped soybeans with consensus SoySNP50K SNP signatures predictive of rhg1‐a. *Note that none of the sampled RAC ‐ (G SNP) accessions had rhg1‐a (none encoded α‐SNAPRhg1LC). “S”: susceptible in all trials, “MS”: moderately susceptible in at least one trial, “MR”: moderately resistant in at least one trial, “R”: resistant in at least one trial. Fisher's Exact Test pairwise comparisons: “R‐MR” (p = 2.6E‐4), “R‐MS” (p = 2.3E‐11), “R‐S” (p = 2.2E‐16), “MR‐MS” (p = 1.0), “MR‐S” (p = .25), “MS‐S” (p = 2.4E‐3). (b) Frequency of SNPs associated with Rhg4 (ss715602757, ss715602764) or the Chromosome 11‐encoded α‐SNAP intron‐retention (α‐SNAPCh11IR) allele, ss71559743 among 19,645 USDA accessions. (c) Frequency of the Rhg4 and α‐SNAPCh11IR associated SNPs among the 51 “Resistant” scored RAC + rhg1‐a signature accessions. (d) Frequency of the Rhg4 and α‐SNAPCh11‐IR associated SNPs among all RAC + (300) or RAC ‐ (403) USDA G. max accessions with consensus SNP signatures predictive of rhg1‐a (705 total; two accessions undefined for ss715606985 SNP)
