Figure 5.

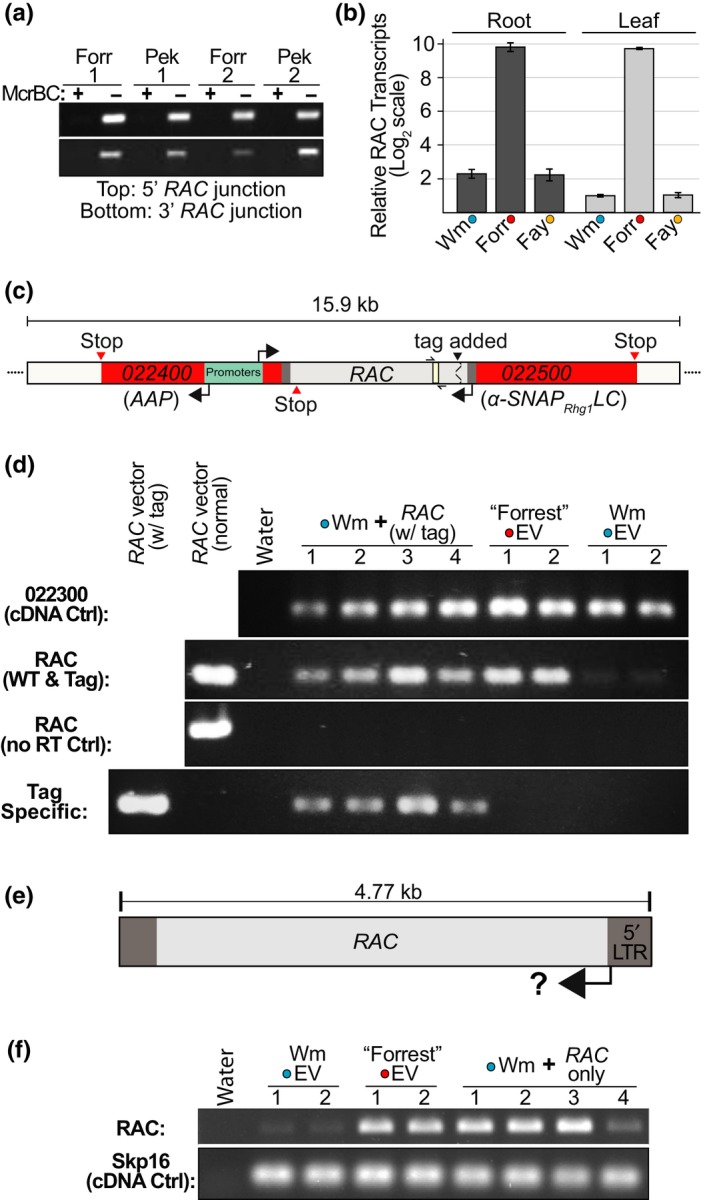
The rhg1‐a RAC element is methylated but has intrinsic transcriptional activity. (a) Agarose gel showing PCR amplicons for α‐SNAP‐RAC regions from McrBC‐treated (+) or mock‐treated (−) genomic DNAs from “Forrest” (Forr) or “Peking” (Pek, PI 548402) roots. (b) qPCR analysis of mRNA transcript abundance for RAC and similar RAC‐like elements, in leaf or root tissues of Williams 82 (Wm; Rhg1WT), “Forrest” (Forr; rhg1‐a) or “Fayette” (Fay; rhg1‐b). Colored dots indicate Rhg1 haplotype as in Figure 1. Normalized RAC transcript abundances are presented relative to the mean abundance of RAC transcript for Williams 82 leaf samples. Y‐axis uses log2 scale. (c) Schematic showing unique nucleotide tag addition to an otherwise native α‐SNAP‐RAC cassette. This construct contains native flanking Rhg1 sequence including Glyma.18G022400 (transcribes from the bidirectional α‐SNAP promoter) and 1.8 kb upstream, as well as 4.7 kb of downstream RAC flanking sequence (~1.0 kb after the α‐SNAPRhg1LC termination codon). The RAC region detected and amplified via qPCR or RT‐PCR is colored ivory and flanked by half‐arrows. (d) Agarose gel of RT‐PCR cDNAs of “Forrest” or Wm 82 transgenic roots transformed with an empty vector (EV) or the native tagged α‐SNAP‐RAC construct. Tag primers amplify only the modified α‐SNAP‐RAC while the normal RAC primer set amplifies both endogenous RAC‐like transcripts as well as the tagged α‐SNAP‐RAC transgene. Glyma.18G022300 mRNA transcript used as a cDNA quality and loading control; no RT (reverse transcriptase) ctrl verifies absence of amplifiable genomic DNA. (e) Schematic showing the sub‐cloned 4.77 kb RAC expression cassette tested in F. (f) Like D, but “Forrest” or Wm 82 roots transformed with empty vector or the 4.77 kb RAC element (all flanking Rhg1 sequence context removed)
