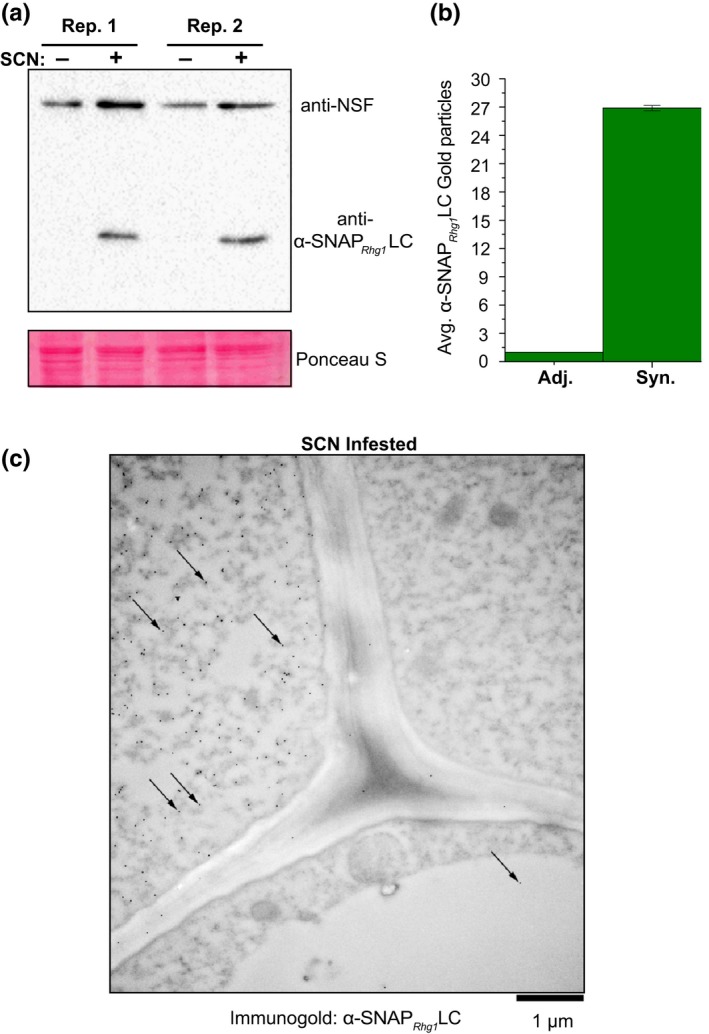
Figure 7.

α‐SNAPRhg1LC hyperaccumulates at SCN infection sites in low‐copy rhg1‐a soybean accession “Forrest.” (a) Immunoblot of non‐transgenic “Forrest” root samples from SCN‐infested root regions (SCN +) harvested 4 days after SCN infection, or similar regions from mock‐inoculated controls (SCN −). Blot was probed simultaneously with anti‐α‐SNAPRhg1LC and anti‐NSF polyclonal antibodies. Ponceau S staining before blotting served as a loading control. (b) Representative electron microscope image (7 dpi) showing anti‐α‐SNAPRhg1LC immunogold signal in SCN‐associated syncytium cells from “Forrest” roots. Arrows highlight only some of the 15 nm immunogold particle dots. Frequent α‐SNAPRhg1LC signal was observed in syncytium cells (upper left, “Syn”) but rare in adjacent cells (upper right and bottom, “Adj.”). CW, cell wall; M, mitochondrion; Vac, vacuole. Bar = 1 µm. (c) Mean and SEM of α‐SNAPRhg1LC gold particle abundance in syncytia, normalized to the count from adjacent cells in the same image. Anti‐α‐SNAPRhg1LC immunogold particles were counted for one 9 µm2 area within cells having syncytium morphology and in a region with the highest observable signal in directly adjacent cells with normal root cell morphology (large central vacuole). Data are for 23 images (11 and 12 root sections, respectively, from two experiments), for root sections 7 days after inoculation
