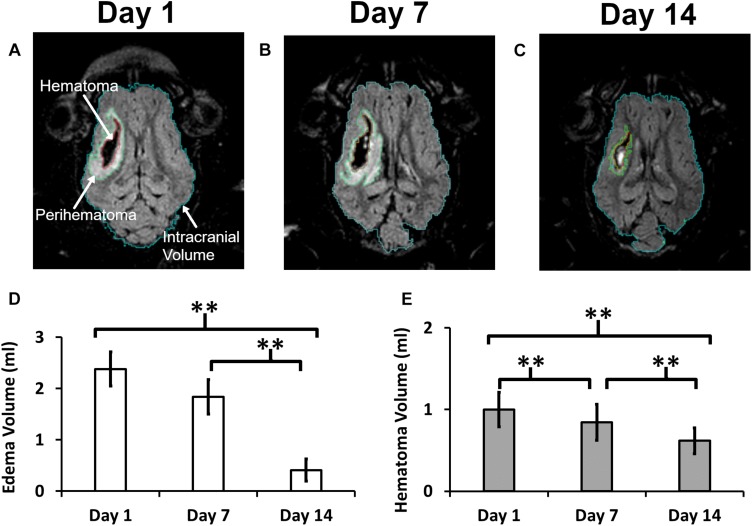
FIGURE 1.
A quantitative summary of the change in hematoma and edema volume in a post-ICH pig brain. Panels (A–C) illustrate a representative MRI image showing outlined boundaries of intracranial volume, perihematoma, and hematoma at days 1, 7, and 14, respectively. Panels (D,E) show Perihematoma edema (D) and hematoma (E) volumes. A double asterisk (∗∗) denotes the significant temporal ipsilesional difference between the time point (p < 0.05). The error bars represent standard error in the mean.

