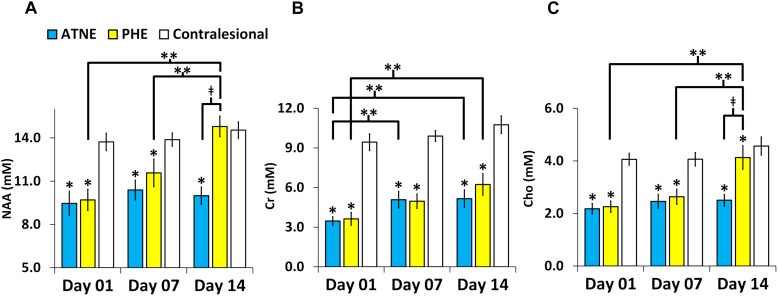
FIGURE 3.
Metabolite concentration in the perihematomal edema (PHE), adjacent tissues with no edema (ATNE), and contralesional voxels over two week follow-up post ICH. (A–C) Represent serial NAA, Cr, and Cho concentrations, respectively. The asterisk (∗) denotes significant (p < 0.001) hemispheric differences, the double asterisk (∗∗) denotes significant (p < 0.001) temporal difference and (‡) denotes significant (p < 0.001) change between PHE and ATNE. The error bars represent standard error in the mean.

