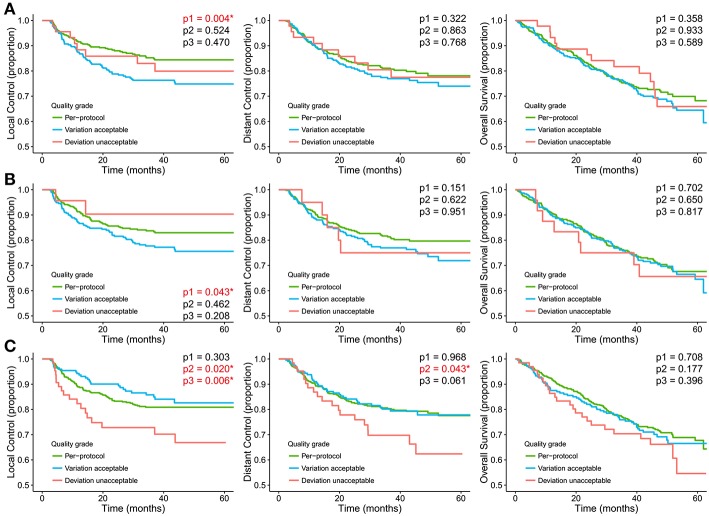
Figure 2.
Kaplan-Meier curves stratified for the RTQA scores (A) Target volume (TV) contour quality score, (B) Organ at risk (OAR) contour quality score, (C) Target dose-volume score. p1 represents the p-value of log-rank test between per-protocol and variation acceptable; p2 represents the p-value of log-rank test between per-protocol and unacceptable; p3 represents the p-value of log-rank test between variation acceptable and unacceptable. *represent p-value < 0.05.

