Figure 4.

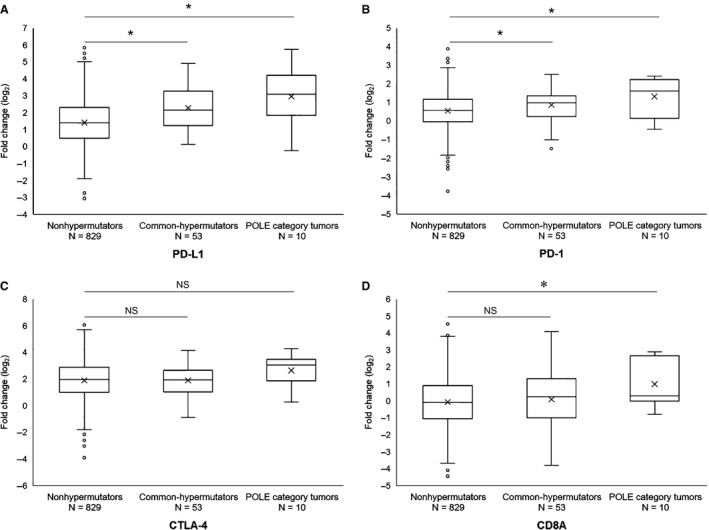
Association between the expression levels of genes associated with tumor immune responses and tumor classification. A, Comparison of PD‐L1. B, Comparison of PD‐1. C, Comparison of CTLA‐4. D, Comparison of CD8A. *P < 0.05

Association between the expression levels of genes associated with tumor immune responses and tumor classification. A, Comparison of PD‐L1. B, Comparison of PD‐1. C, Comparison of CTLA‐4. D, Comparison of CD8A. *P < 0.05