Figure 2.

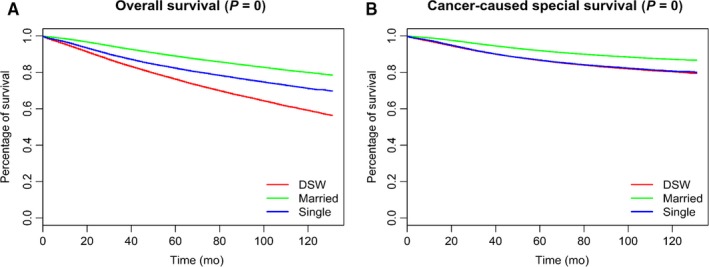
Kaplan‐Meier Survival curves: The overall (A) and cancer‐caused special survival (B) of patients with breast cancer according to marital status

Kaplan‐Meier Survival curves: The overall (A) and cancer‐caused special survival (B) of patients with breast cancer according to marital status