Figure 1.

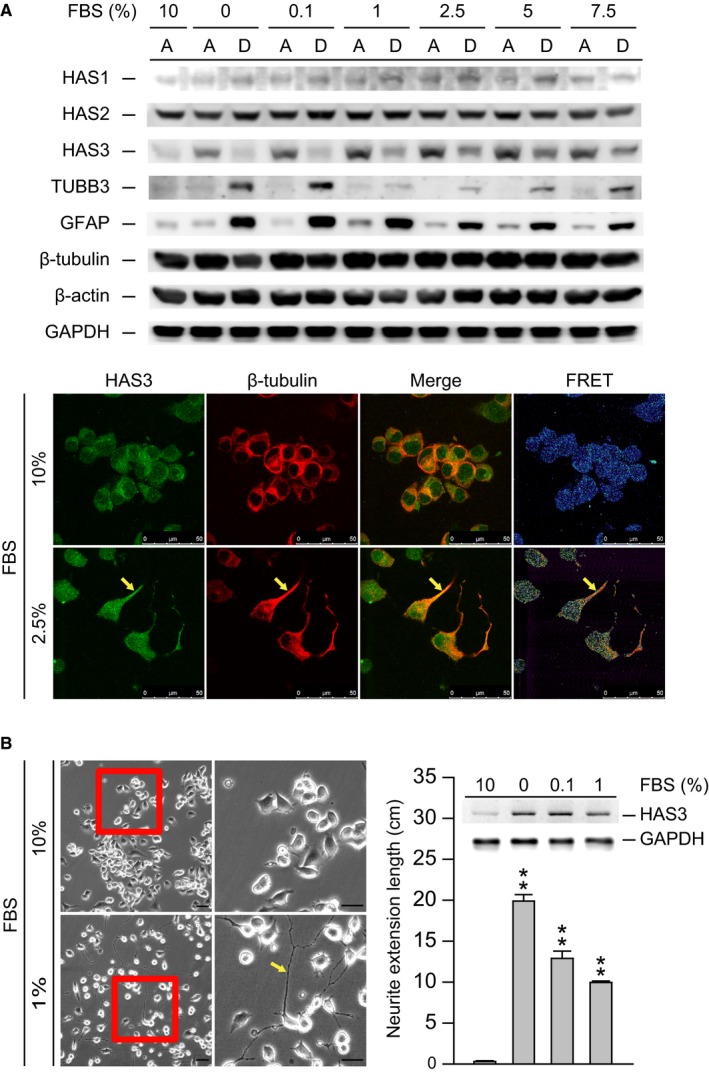
Starvation induces N2a cell differentiation via HAS3 upregulation. (A) N2a cells were treated with 0%‐10% serum for 24 h. The treated cells were assessed for HAS1, HAS2, HAS3, TUBB3, GFAP, β‐tubulin, and α‐actin by Western blot analysis (A = attached cells, D = detached cells). The results were normalized to α‐actin. N2a cells were treated with 2.5 or 10% serum. Differentiated cells were stained with HAS3‐rhodamine and β‐tubulin ‐FITC. The colocalization of HAS3 and β‐tubulin was measured by FRET analysis. Magnification, 630×; scale bar, 50 μm. (B) N2a cells were treated with 0%, 0.1%, 1% or 10% serum. The morphology of the differentiated cells was captured by microscopy. Magnification, 100×; scale bar, 10 μm. Differentiated cells were assessed for HAS3 and GAPDH by Western blot analysis. The results were normalized to GAPDH. Neurite length was measured in six randomly selected microscopic fields using ImageJ software. The data are presented as the mean ± SD; **P < 0.01 compared with the control group
