Figure 4.

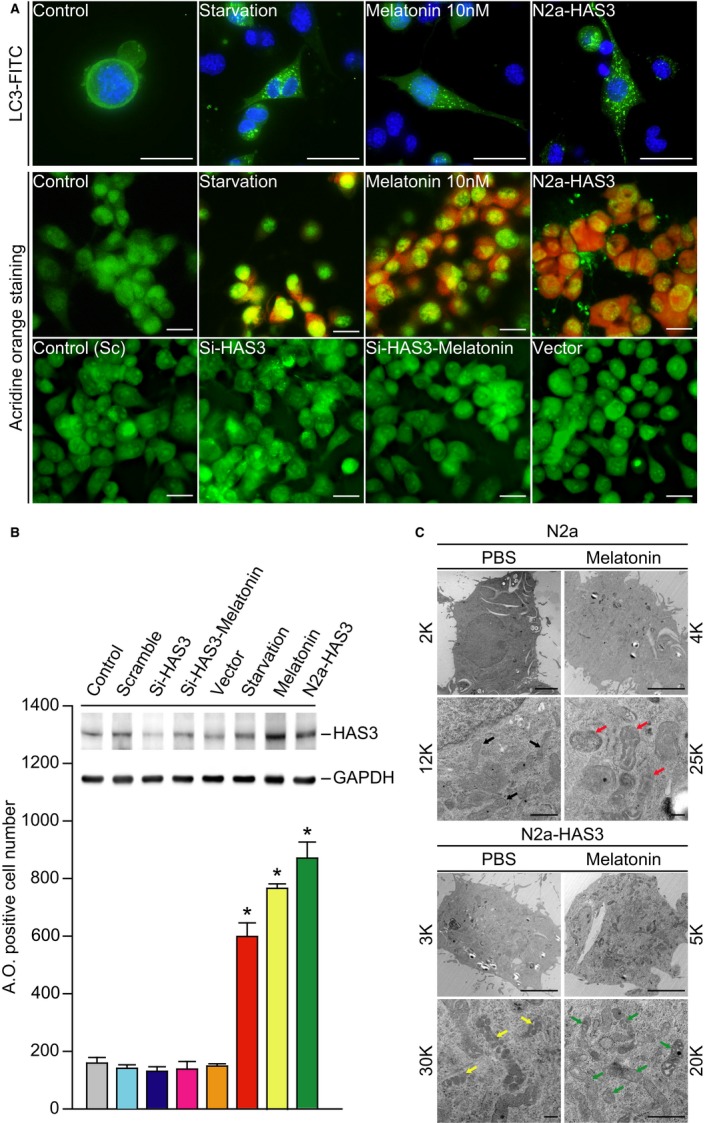
Melatonin induces N2a cell autophagy via HAS3 upregulation. (A) Fluorescence images of acidic vesicles stained with AO (1 µmol/L) and immunofluorescence staining results of LC3 protein expression following starvation, melatonin treatment (10 nmol/L) or HAS3 overexpression. Magnification, 630× and 100×; scale bar, 10 μm. (B) The quantitation of AO‐positive cells is presented for the starvation, melatonin (10 nmol/L) and HAS3 overexpression groups. Each group of cell lysates was assessed for HAS3 and GAPDH expression by Western blot analysis. (C) Mitochondrial damage was detected by TEM in melatonin‐treated and untreated HAS3‐induced N2a cells and in control N2a cells. The data are presented as the mean ± SD; *P < 0.05
