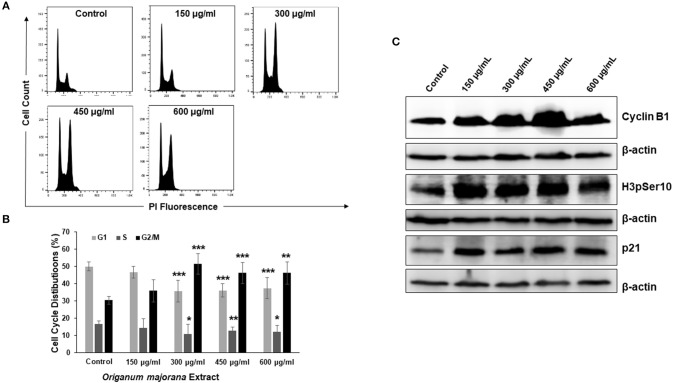
Figure 4.
OME induces a mitotic arrest in HT-29 cells. (A,B) Cell cycle distribution analysis in HT-29 cells treated with and without OME (0, 150, 300, 450, and 600 μg/mL) for 24 h. Values are represented as mean ± SD of n = 3 (*p < 0.05, **p < 0.005, and ***p < 0.001). (C) Alteration in proteins associated with cell cycle regulation in OME-treated HT-29 cells.

