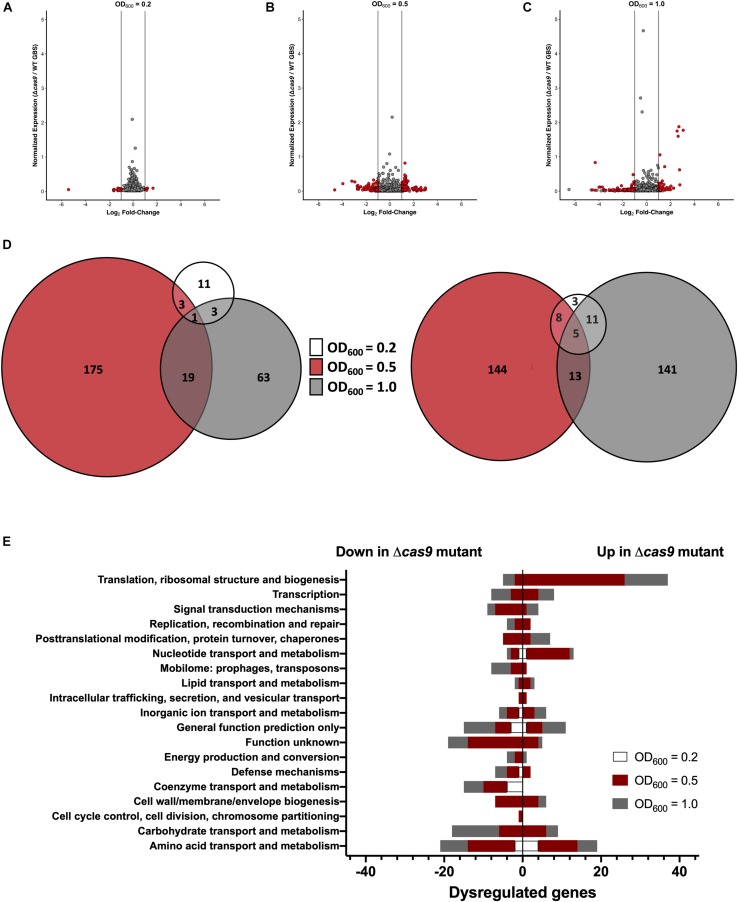
FIGURE 4.
Cas9 globally regulates the GBS genome. RNA-Seq analysis was performed on RNA isolated from COH1 and COH1Δcas9 cultures grown in THB to early-, mid- and late-log growth phases (OD600 = 0.2, 0.5, and 1.0, respectively). Three biological replicates were analyzed for each strain. Volcano plots indicate combined analysis from DESeq2 and EdgeR at (A) OD600 = 0.2, (B) OD600 = 0.5, and (C) OD600 = 1.0. Red dots indicate hits that were significantly dysregulated (p < 0.05, fold change >±2). Gray dots indicate non-significant hits. (D) Total number of dysregulated genes between COH1 and COH1Δcas9 strains at each growth phase by Venn diagram. The Venn diagram on the left indicates the number of genes that are up-regulated in the Δcas9 mutant compared to WT COH1 and the Venn diagram on the right indicates the number of genes that are down-regulated in the Δcas9 mutant compared to WT COH1. (E) Clusters of Orthologous Groups of proteins designations assigned to significantly dysregulated genes in the Δcas9 mutant compared to WT COH1, as assigned by Integrated Microbial Genomes & Microbiomes (IMG/M) system at the JGI. Bars to the left indicate genes that are down-regulated in the Δcas9 mutant compared to WT COH1, whereas bars to the right indicate genes that are up-regulated in the Δcas9 mutant compared to WT COH1.

