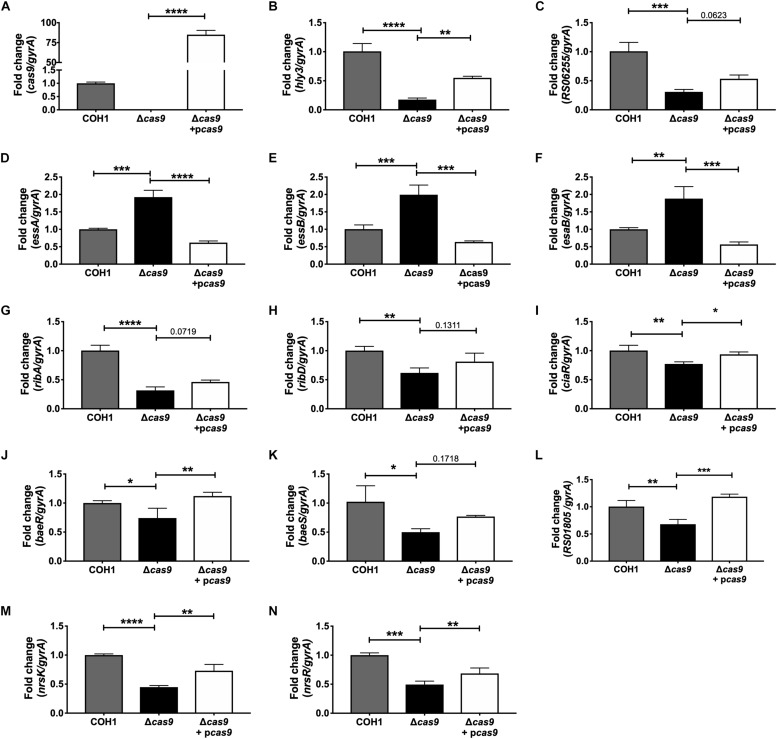
FIGURE 5.
qRT-PCR confirmation of RNA-Seq analysis. Transcript abundances of significantly dysregulated genes identified in RNA-Seq analysis were confirmed in WT, Δcas9, and Δcas9 + pcas9 strains. (A–N) Fold change was calculated using the ΔΔCT equation. n = 3 cultures, One-way ANOVA with Sidak’s multiple comparisons, with comparisons made to the Δcas9 mutant, ∗p < 0.05; ∗∗p < 0.01; ∗∗∗p < 0.001; ∗∗∗∗p < 0.0001.

