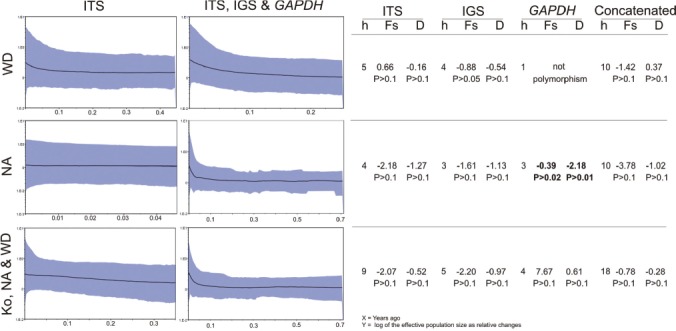
Fig. 5.

Bryoria sect. Implexae. – Left. Bayesian Skyline Plots for each clade predicted by the ITS marker and the concatenated loci matrix. The X-axis of each graph represent time (in Myr), and the Y-axis represents the value for the log of the effective population size as relative changes, because generation times in Bryoria species are unknown. Grey shadows indicate the upper and lower 95 % credible intervals. – Right. Results from neutrality tests for each marker and clade, indicating (in bold) any statistically significant deviation from neutrality. — h = number of haplotypes; Fs = Fu’s Fs; D = Tajima’s D.
