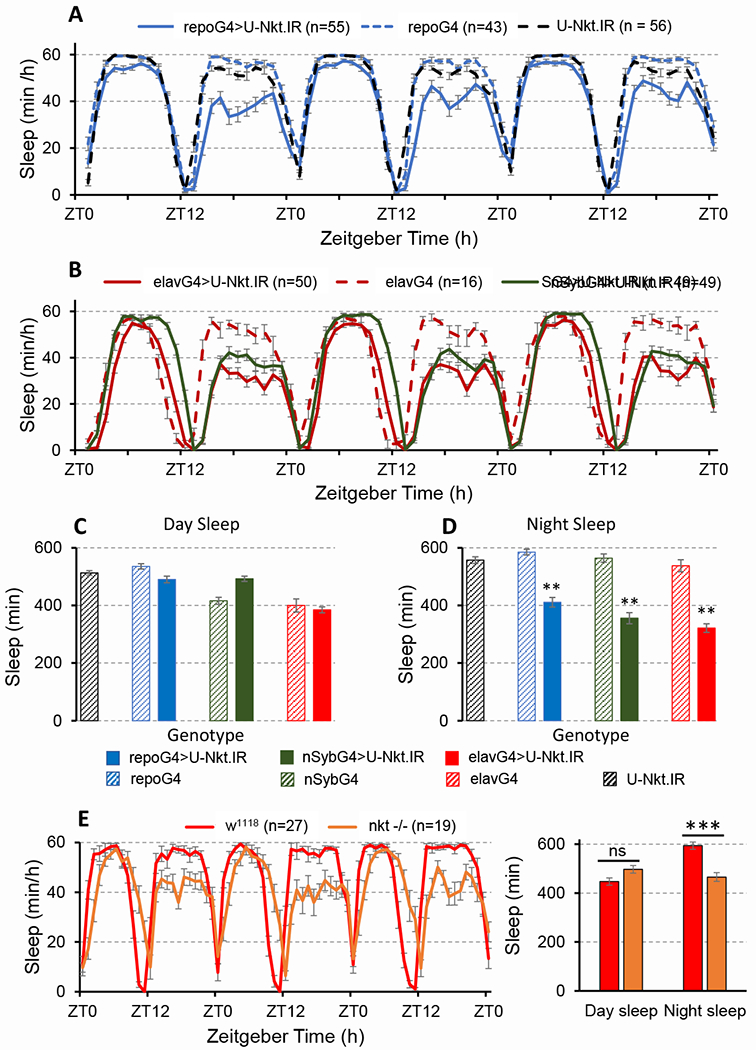
Figure 1. Nkt deficits lead to reduced night sleep with no effect on day sleep.

A-B) Population sleep profiles (Day 2 -Day 4) for flies in LD 12:12 with either pan-glial (A) or pan-neuronal (B) Nkt knockdown. RG4, repo-GAL4; eG4, elav-GAL4; SG4, NSyb-GAL4. C) Average day sleep in the different genotypes. D) average night sleep. Histograms represent averages for 3 days of LD data. E, F) Sleep phenotype of the Nkt L2-11 null mutant. The mutation was backcrossed into a w1118 background, the control shown in this panel. In this figure and all others, error bars are SEM. **, p<0.01 or ***, p<0.001 relative to U-Nkt.IR or GAL4 controls. See also Figures S1, S2, S3 and S4 and Table S1.
