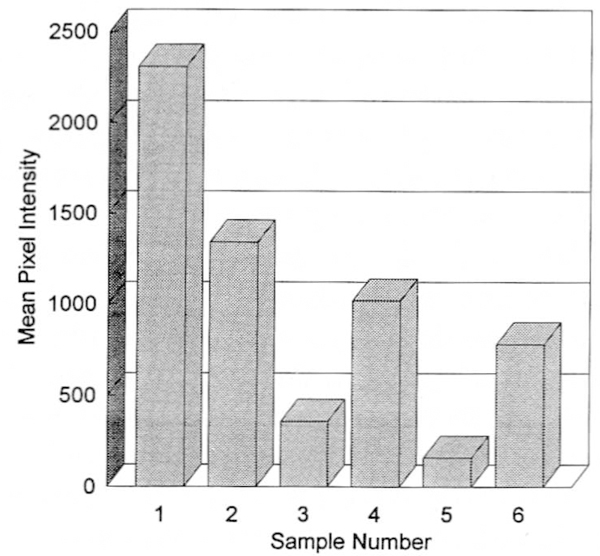
Figure 4.

Graph showing telomeric DNA signal intensity (in pixels) for a specific area (3mm width × 300mm length) for each lane of tumor cells from five patients with GCT and HeLa by analyzing autoradiographs exposed for 18 hours from the telomerase activity assay. Sample number 1, HeLa; sample numbers 2–6, GCT patients 1–5, respectively, (25 μg of HeLa cell extract and 250μg of GCT cell extract were used per patient per analysis).
