
Figure 7:
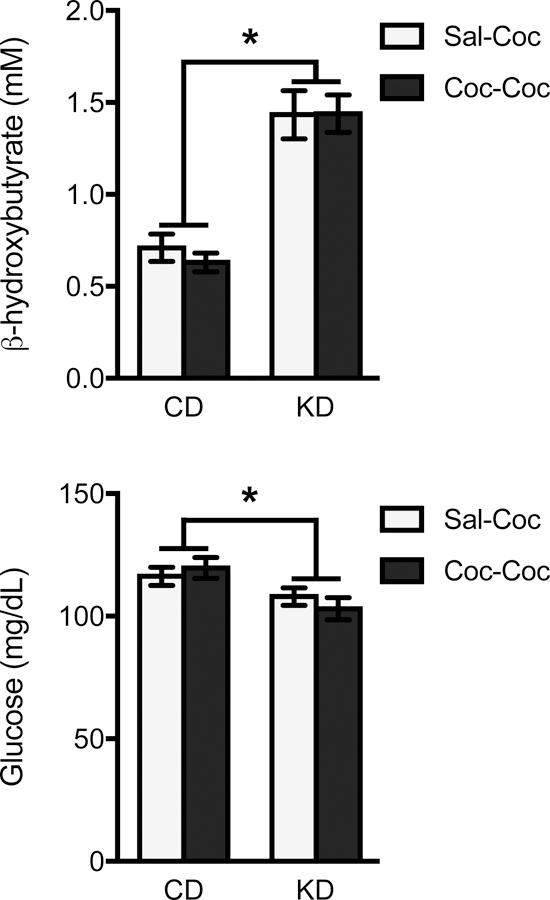
Mean (+/− SEM) blood ketone (β-hydroxybutyrate) and glucose levels taken at the conclusion of the experiment. Data were collapsed across sex (diet x sex interaction was non-significant). Rats treated with a ketogenic diet (KD) had significantly higher blood ketone levels and significantly lower blood glucose levels vs. control diet (CD)-treated rats. *p < .05, CD vs. KD comparison.