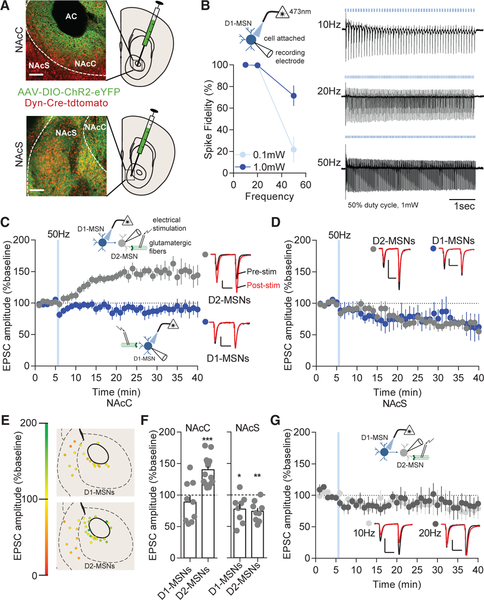
Figure 1. High-Frequency D1-MSN Stimulation Potentiates Excitatory Transmission on D2-MSNs.
(A) Representative expression in the NAc core (NAcC) or shell (NAcS). Red, Dyn-Cre-Tdtomato; green, ChR2-eYFP. AC, anterior commissure. Scale bars: 100 μm.
(B) Cell-attached recordings of D1-MSNs (blue) expressing ChR2 was stimulated with 473-nm blue laser light. Fidelity of D1-MSN firing in cell attached mode is lower at 0.1 mW than 1.0 mW blue light (p < 0.01; n = 5 and 9). Representative traces at 10-, 20-, or 50-Hz stimulation are shown.
(C) NAcC D2-MSNs (gray) were potentiated by a single train of 50-Hz D1-MSN stimulation (p < 0.05; n = 14), and there was no effect on D1-MSNs (blue; p > 0.05; n = 9). Representative paired-pulse excitatory traces pre-stimulation (black) and post-stimulation (red) are shown. Scale bars for synaptic recordings: 100 pA, 25 ms.(D) NAcS D1-MSNs (p < 0.05; n = 8) and D2-MSNs (p < 0.05; n = 9) EPSCs were depressed by D1-MSN 50-Hz stimulation.
(E) Coronal map of EPSC potentiation (green) or depression (red) of MSN subtypes following D1-MSN 50-Hz stimulation.
(F) Potentiation of EPSCs is observed in NAcC D2-MSNs (p < 0.001; n = 9 and 14) and depression of EPSCs in all NAcS MSNs at 20 min from baseline (D1-MSN and D2-MSN; p < 0.01; n = 9 and 8).
(G) 10-Hz (p > 0.05; n = 5) and 20-Hz (p > 0.05; n = 5) stimulation does not alter D2-MSN excitatory transmission.
Error bars represent SEM. *p < 0.05, **p < 0.01, ***p < 0.001, ****p < 0.0001. For exact statistics, see Table S1. See also Figure S1.

