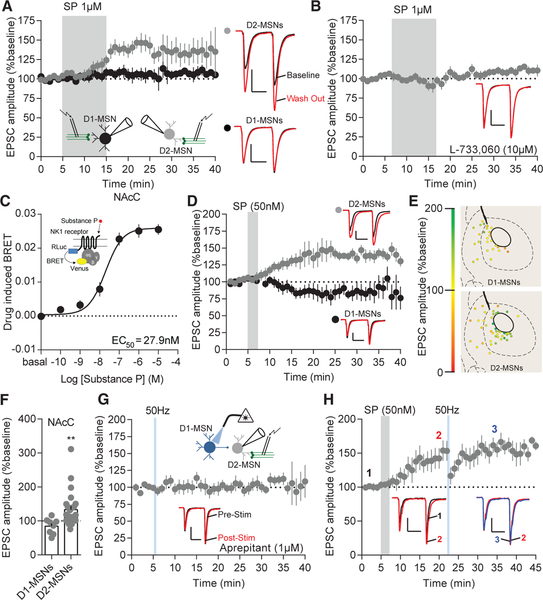
Figure 2. Substance P and 50-Hz D1-MSN Stimulation Drives Excitatory Potentiation through NK1Rs.
(A) EPSCs are enhanced on D2-MSNs after bath application of substance P (p < 0.001; n = 8), but not on D1-MSNs (p > 0.05; n = 5). Representative EPSCs: baseline (black), substance P wash out (red); scale bars for synaptic recordings: 100 pA, 25 ms.
(B) NK1R antagonist L-733,060 blocks substance-P-induced potentiation (p > 0.05; n = 9).
(C) BRET signal in response to different concentrations of substance P.
(D) D2-MSN (p < 0.05; n = 14), but not D1-MSN (p > 0.05; n = 6), EPSCs potentiate in response to substance P bath application.
(E) Coronal map of EPSC potentiation (green) or depression (red) of MSN subtypes following bath application of substance P.
(F) D2-MSN (p < 0.01; n = 24), but not D1-MSN (p > 0.05; n = 8), EPSCs are potentiated at after substance P bath application.
(G) NK1R antagonist aprepitant blocks D1-MSN stimulation-induced potentiation (p > 0.05; n = 8).
(H) Substance P bath application occludes potentiation of D1-MSN 50-Hz stimulation on NAcC D2-MSNs (1 to 2, p < 0.05, n = 7; 2 to 3, p > 0.05, n = 7).
Error bars represent SEM. *p < 0.05, **p < 0.01, ***p < 0.001, ****p < 0.0001. For exact statistics, see Table S1. See also Figure S2.

