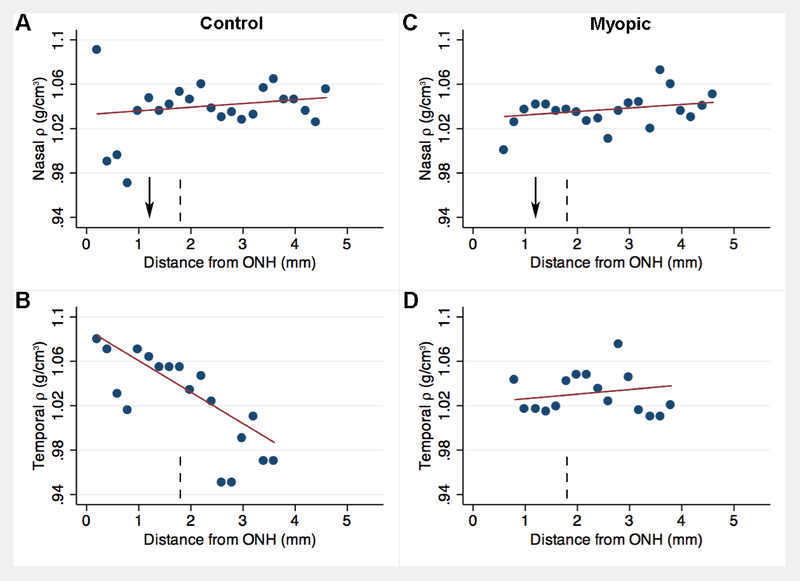
Figure 8.
Binned scatterplot comparing horizontal distance (horizontal axis, in mm from vertical midline of the optic nerve head (ONH)) to mass density (vertical axis, ρ, in g/cm3) for control eyes (A,B) and contralateral myopic eyes (C,D) in horizontally-sectioned guinea pig pup eyes. Top panels represent nasal distance and bottom panels represent temporal distance from the ONH vertical midline. Each dot represents the mean from up to 10 ROIs from 5 animals measured at the given distance. Red line is the linear regression trendline for N = 175 – 182 data points. Vertical dashed line notes upper boundary of the “proximal” region. Arrow marks approximate location of the central axis of the eye.

