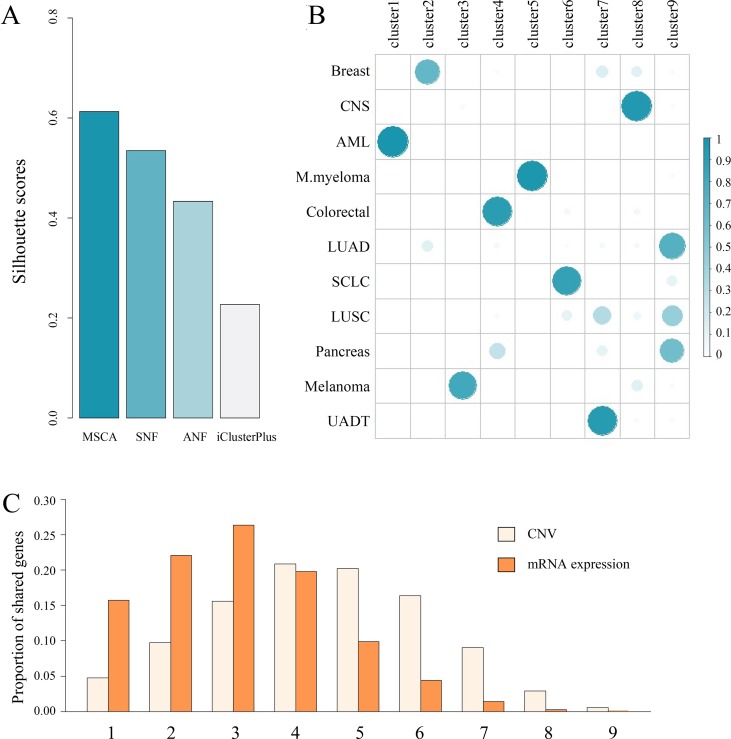
Figure 4.
A case study on CCLE dataset. (A) Comparison of the integrative clustering results obtained by MSCA, SNF, ANF and iClusterPlus. Note that the number of clusters is the same, i.e., 9 for the four methods. (B) Illustration of associations between histological origins (i.e., rows) and integrated cell clusters (i.e., columns). Sum of each row equals 1. (C) A brief summary of remarkable features across clusters. x-axis indicates the number of shared groups. Breast, breast cancer; CNS, central nervous systems; AML, acute myelocytic leukemia; M.myeloma, multiple myeloma; Colorectal, colorectal cancer; LUAD, lung adenocarcinoma; SCLC, small cell lung cancer; LUSC, lung squamous cell carcinoma; Pancreas, pancreas cancer; UADT, upper aerodigestive tract cancer.

