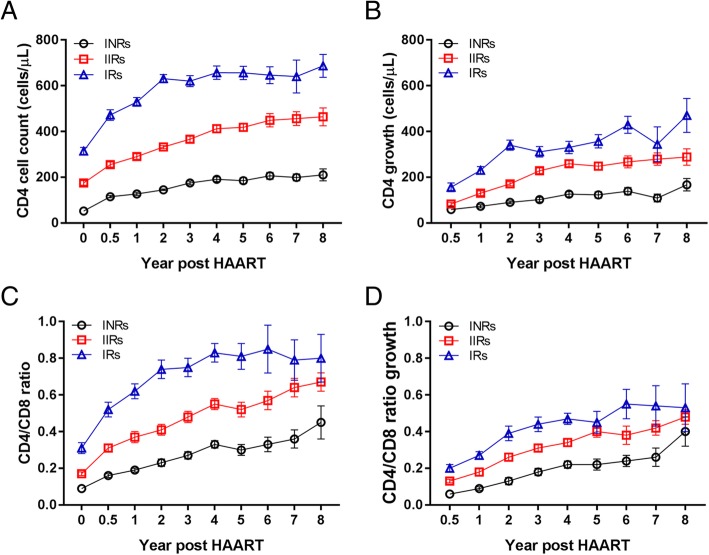
Fig. 1.
The characteristics of immune reconstitution in three groups. (a) The dynamics of CD4 cell counts at different time-points (from 0 ~ 8 years). (b) The dynamics of CD4 cell count growth at different time-points (from 0.5 ~ 8 years). (c) The dynamics of CD4/CD8 ratios at different time-points (from 0 ~ 8 years). (d) The dynamics of CD4/CD8 ratio growth at different time-points (from 0.5 ~ 8 years). The data are presented with median ± SE. The black cycles indicate the INRs, the red squares depict the IIRs, and the blue triangles indicate the IRs

