Fig. 2.

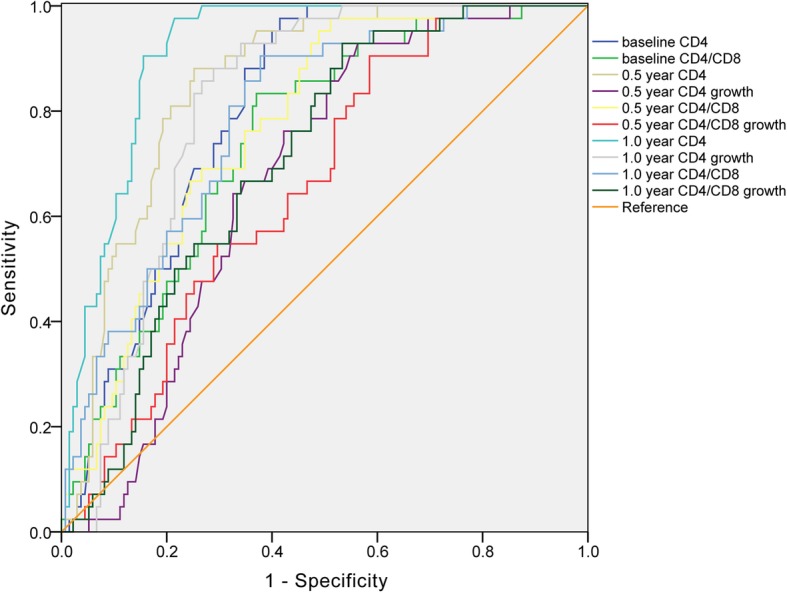
The ROC cure of predictive indexes. The X-axis depicts the specificity of predictor, the Y-axis indicates the sensitivity of the predictor. The diagonal line is the reference

The ROC cure of predictive indexes. The X-axis depicts the specificity of predictor, the Y-axis indicates the sensitivity of the predictor. The diagonal line is the reference