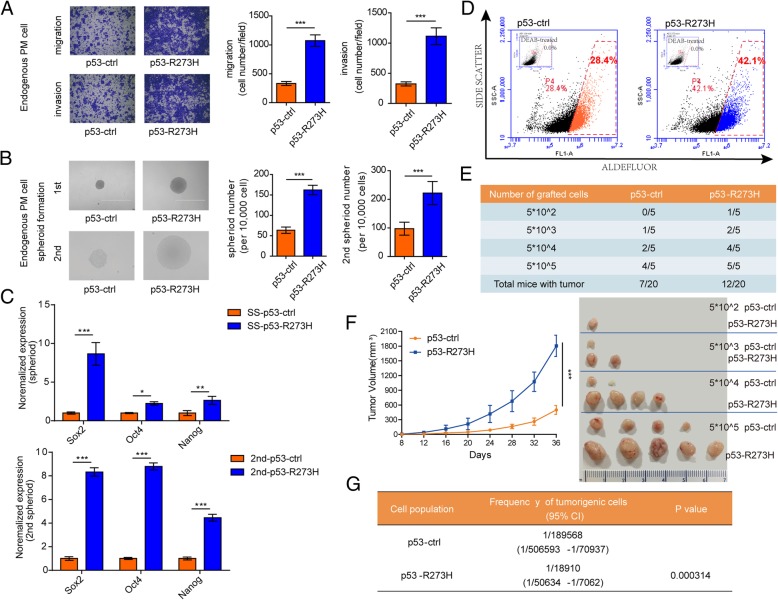
Fig. 2.
P53-R273H mutation promotes CSC expansion and in vitro and in vivo. a. Images (left) and statistics (right) of the migration assay and invasion assay of HCT116 p53 endogenous point mutant (PM) cell lines. b. The spheroids size (left) and number (right) of 1st spheroid formation and 2nd spheroid formation assay of HCT116 p53 endogenous point mutant (PM) cell lines. Scale bar, 400 μM. c. The relative expression of stemness-related genes (Sox2, Oct4, Nanog) in HCT116 p53 endogenous point mutant (PM) cell lines assessed by RT-qPCR analysis. d. ALDH1 activity was determined using the Aldefluor assay system in endogenous point mutant cells. ALDH1 inhibitor DEAB-treated cells were used as a negative control. Cell population with Aldefluor-derived fluorescence intensity was analyzed using flow cytometry. e. HCT116 p53 endogenous point mutant (PM) spheroid cells were diluted and subcutaneously implanted into BALB/c nude mice and tumor-free mice were monitored. N = 5 for each group. f. HCT116 p53 endogenous point mutant (PM) spheroid cells were subcutaneously injected into BALB/c nude mice to observe the growth of tumors. The tumor volumes were measured at the indicated time points (left), and images of tumors from nude mice at autopsy are presented (right). N = 5 for each group. G. Tumorigenic cell frequency of HCT116 p53 endogenous point mutant (PM) spheroid cells was determined with ELDA analysis (http://bioinf.wehi.edu.au/software/elda/). CI, confidence interval. The experiments were performed in triplicate (a-d). Data are shown as means ± SD. *p < 0.05, **p < 0.01, and ***p < 0.001

