
Fig. 1.
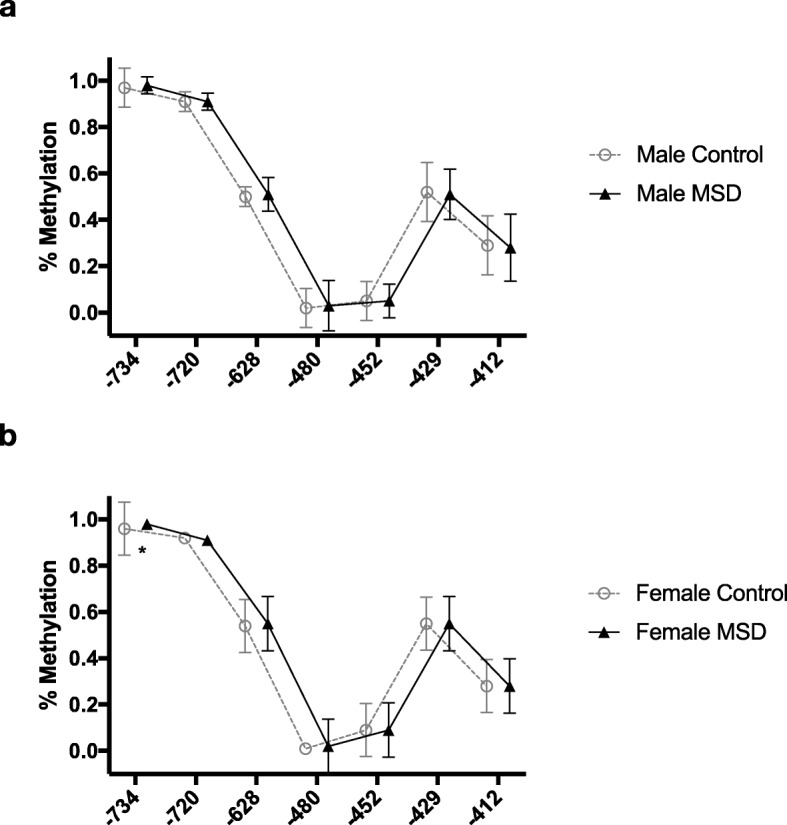
Methylation for each CpG position is depicted for each sex and control (gray circles) or multisomatoform disorder (MSD) cohort (filled triangles). In the entire population not divided by gender (a), men (b), and women (c), individual levels between cohorts reveal similar methylation. CpG position is noted in relation to transcription start site (TSS) according to ENSEMBL entry for the TrpA1 gene (#ENSG00000104321). Error bars depict standard deviation