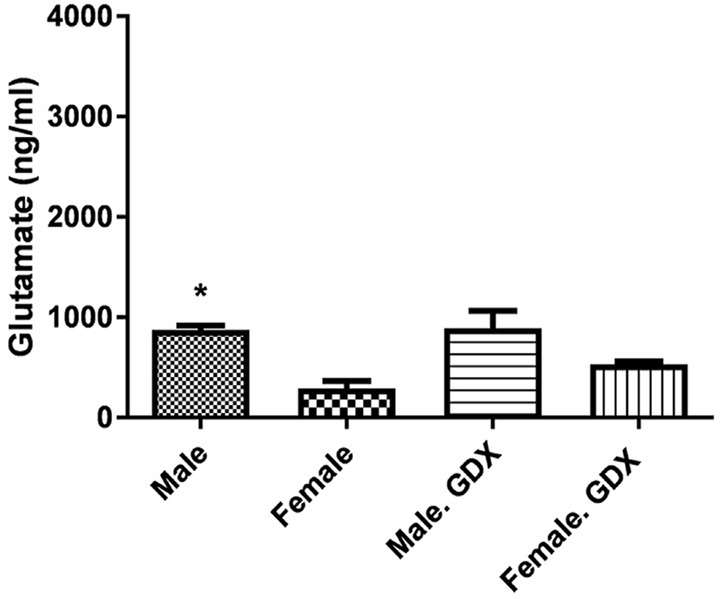
Figure 2.

Sex differences in the spinal glutamate level in rats (n=3)
Data are presented as Mean±SEM; The repeated measure of 1-way Analysis of Variance (ANOVA) followed by Tukey post hoc test. * P<0.05 intact male vs. female rats

Sex differences in the spinal glutamate level in rats (n=3)
Data are presented as Mean±SEM; The repeated measure of 1-way Analysis of Variance (ANOVA) followed by Tukey post hoc test. * P<0.05 intact male vs. female rats