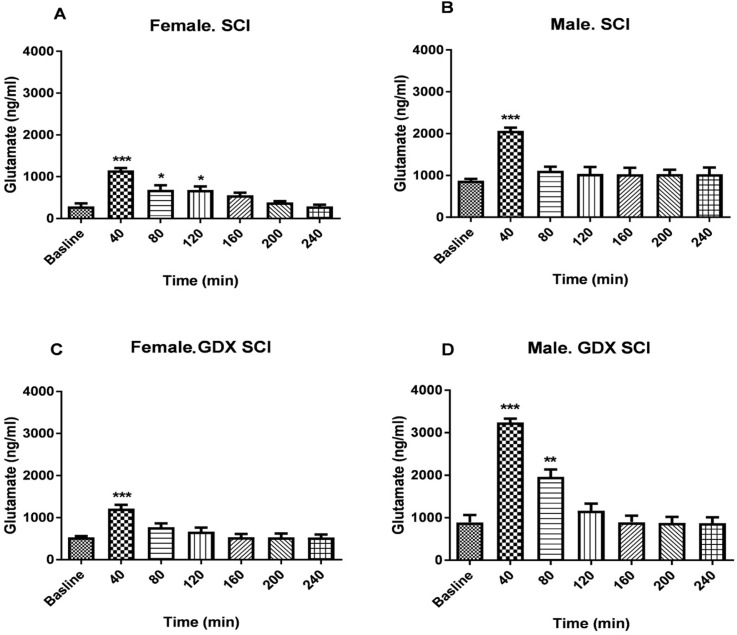
Figure 3.
Changes in spinal glutamate level after Spinal Cord Injury (n=3)
SCI female rats (A); SCI male rats (B); GDX+SCI female rats (C); and GDX+SCI male rats (D).
The samples were collected during 40 min time and those started with a baseline and after injury continued for 4 h in both intact and gonadectomized rats. Data are presented as Mean±SEM. The repeated measure of 1-way Analysis of Variance (ANOVA) followed by Tukey test.
* P<0.05; ** P<0.01; *** P<0.001 vs. baseline

