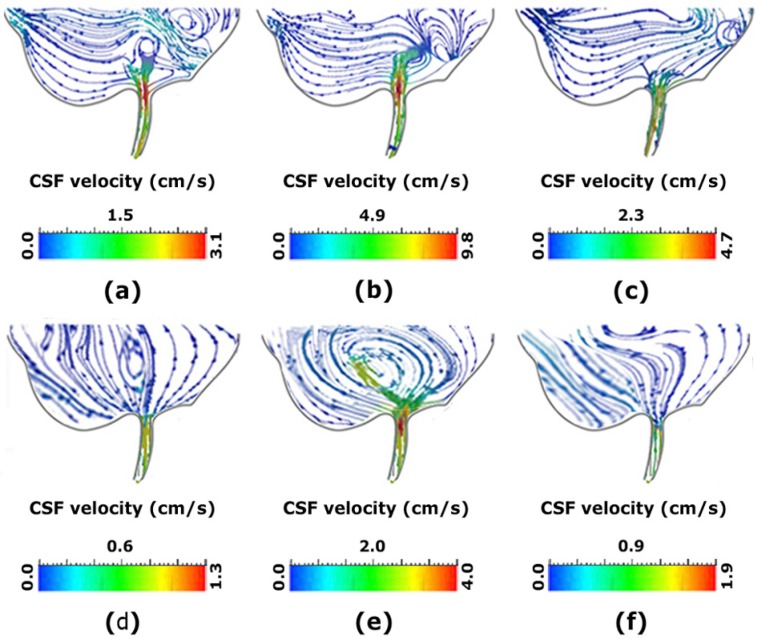
Figure 5.
Comparison CSF velocity and vortex in samples
a–c. Shows the vortex in the inferior section of the third ventricle of a patient with NCH before shunting; d–f. Shows the vortex in the inferior section of the third ventricle of a normal subject; b, e. Shows the vortex during the fill period; and c, f. Shows it during the flush period (Gholampour, 2018).

