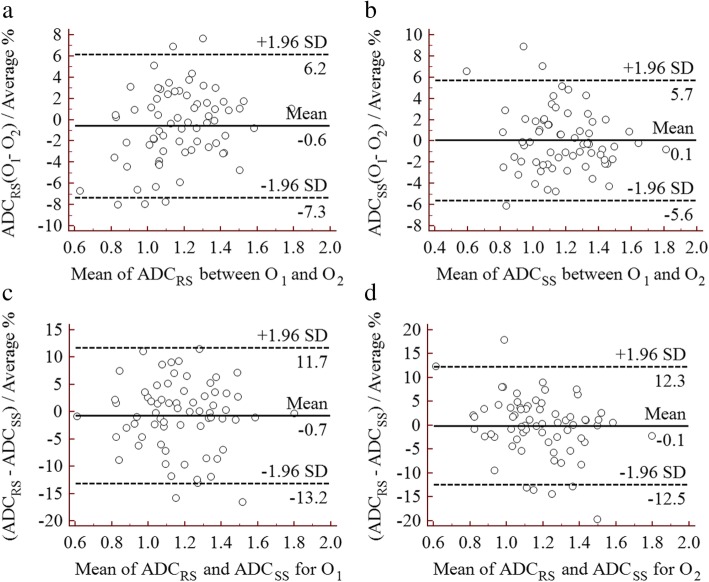
Fig. 5.
Bland-Altman plots of the ADC values for the RS-EPI and SS-EPI techniques and observers 1 and 2. a Comparison of ADC values derived from RS-EPI (ADCRS) between observer 1 (O1) and observer 2 (O2). b Comparison of ADC values derived from SS-EPI (ADCSS) between O1 and O2. c Comparison of ADC values measured by O1 between RS-EPI and SS-EPI. d Comparison of ADC values measured by O2, between RS-EPI and SS-EPI

