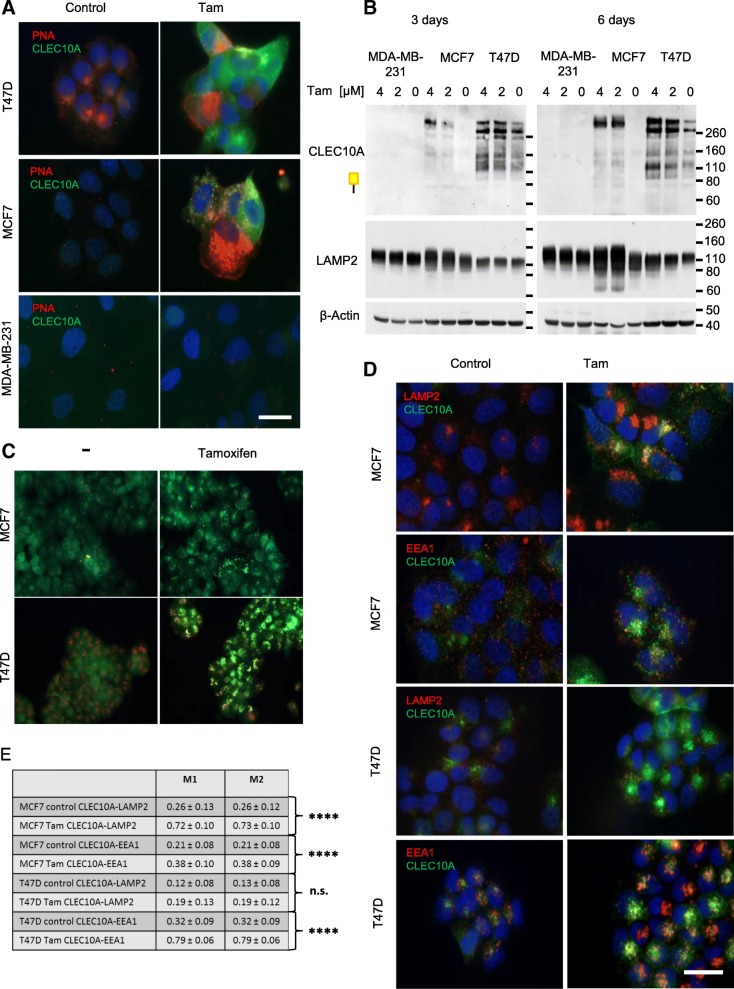
Fig. 3.
Impaired glycan synthesis and endosomal/lysosomal processing results in the accumulation of CLEC10A positive glycan structures after Tam treatment of breast cancer cell lines. a Immunofluorescence of MCF7, T47D and MDA-MB-231 cells treated by Tam (4 μM) or ethanol (control) for 72 h. Cells were fixed and stained with recombinant CLEC10A using an anti c-myc antibody and a secondary anti-mouse antibody labeled with Alexa 488 (green) or PNA labeled with Streptavidin-Cy3 (red); nuclei (blue) were counterstained by DAPI. Scale bar: 20 μm. b Western blot analysis of whole cellular extracts of MCF7, T47D and MDA-MB-231 treated with 2 μM and 4 μM Tam for 3 and 6 days, respectively. Lysosomal membrane protein LAMP2 was detected using a monoclonal antibody. β-actin served as control for equal loading. c MCF7 and T47D cells stained with acridine orange after treatment with 4 μM Tamoxifen (Tam) for 48 h; ethanol treated cells served as control (−). Upon exposure to Tam intracellular vesicles increase in size and stain green or yellow suggesting lysosomal swelling and an increase in lysosomal pH; scale bar: 20 μm. d Co-localization of CLEC10A ligands (Alexa 488, green) with LAMP2-positive lysosomes or EEA1-positive early endosomes (Alexa 555, red). MCF7 and T47D cells were treated with 4 μM Tamoxifen or ethanol (control) for 48 h, respectively. Yellow indicates co-localization in merged images. Nuclei (blue) were visualized by DAPI staining. Scale bar: 20 μm. e Mander’s coefficient of the co-localization of CLEC10A with early endosomes and lysosomes. For statistical anaylsis, co-localization was determined in 10 different areas of the image applying JACOB. Averages and standard deviations are given. P-values were calculated by Student’s t-test. **** P < 0.0001

