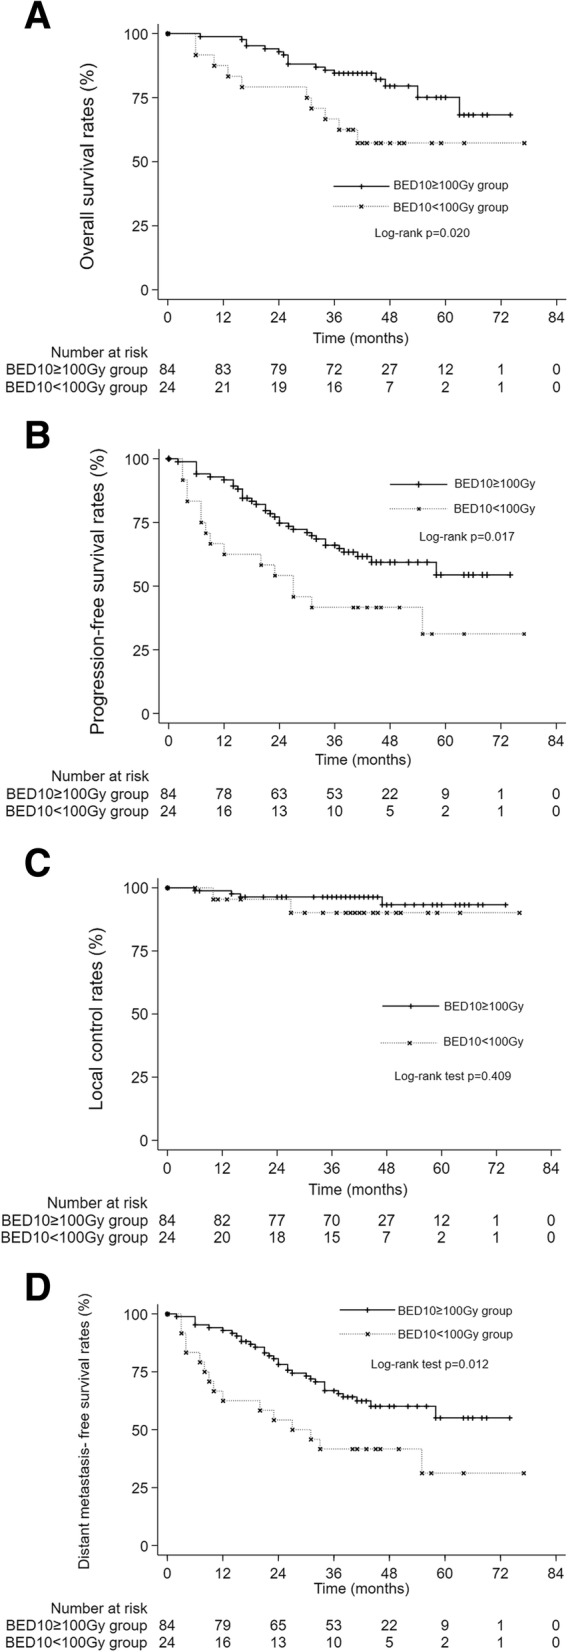
Fig. 3.

A OS in the BED10 ≥ 100 Gy and BED10 < 100 Gy groups. The 1-, 2- and 3-year OS rates were 98.8, 92.9 and 84.5% in the BED10 ≥ 100 Gy group and 87.5, 79.2 and 66.7% in the BED10 < 100 Gy group, respectively (p = 0.020). B PFS in the BED10 ≥ 100 Gy and BED10 < 100 Gy groups. The 1-, 2- and 3-year PFS rates were 91.7, 74.7 and 66.0% in the BED10 ≥ 100 Gy group and 62.5, 54.2 and 41.7% in the BED10 < 100 Gy group, respectively (p = 0. 017). C LC in the BED10 ≥ 100 Gy and BED10 < 100 Gy groups. The 1-, 2- and 3-year LC rates were 98.8, 96.4 and 96.4% in the BED10 ≥ 100 Gy group and 95.5, 95.5 and 90.2% in the BED10 < 100 Gy group, respectively (p = 0.409). D DMFS in the BED10 ≥ 100 Gy and BED10 < 100 Gy groups. The 1-, 2- and 3-year DMFS rates were 92.9, 80.7 and 66.9% in the BED10 ≥ 100 Gy group and 62.5, 54.2 and 41.7% in the BED10 < 100 Gy group, respectively (p = 0.012)
