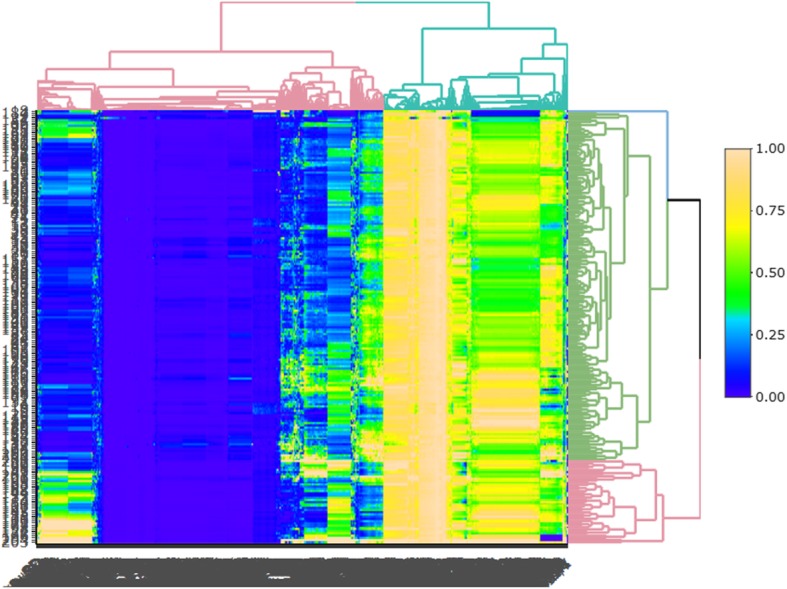
Fig. 2.

Radiomics heatmaps (normalized data). Heatmap depicting correlation coefficient matrix of 1044 features. Unsupervised clustering analysis was used. The heatmap represents the correlation between parameters. The stronger the correlation is, the larger the value (the lighter the color) is, and the worse the correlation is, the smaller the value (the darker the color) is
