Fig. 2.

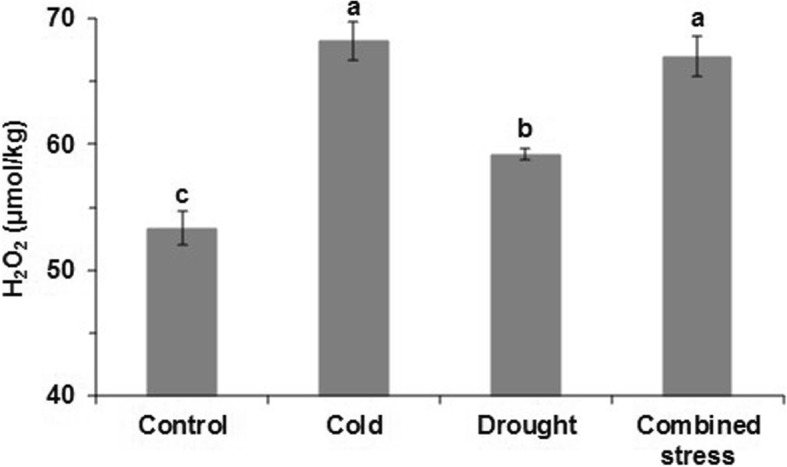
The H2O2 content in leaves of tomato at control, cold, drought and combined stress. The data represents mean values ± SD (n = 3). Different letters indicate significant difference at P < 0.05

The H2O2 content in leaves of tomato at control, cold, drought and combined stress. The data represents mean values ± SD (n = 3). Different letters indicate significant difference at P < 0.05