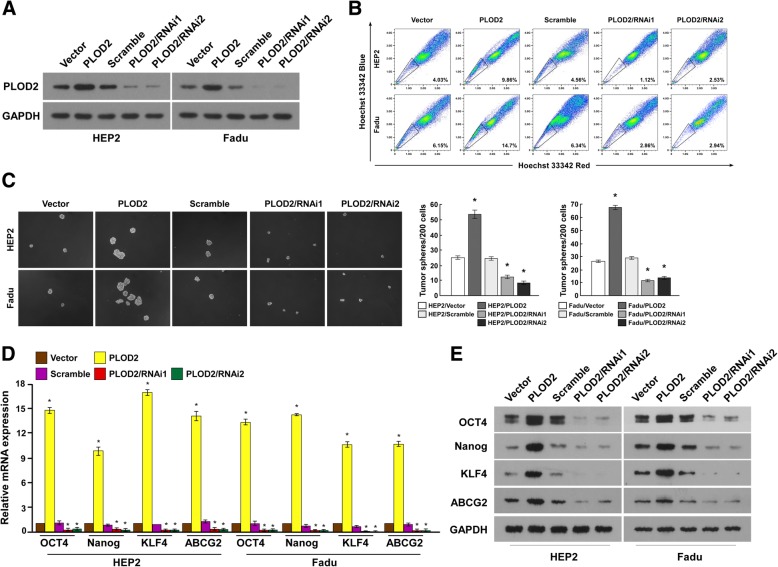
Fig. 4.
Manifestations of PLOD2 maintaining CSC characteristics. a Hep-2 and FaDu cell lines were engineered for the overexpression or silencing of PLOD2. b The SP was analyzed in the different cell lines by multiparametric flow cytometry. c Hep-2 and FaDu cell spheres cultured in medium were photographed; representative images are shown. Scale bar = 50 μm. d The mRNA expression levels of genes representing CSC markers were upregulated. e The protein expression levels of genes representing CSC markers were upregulated. *P < 0.05

