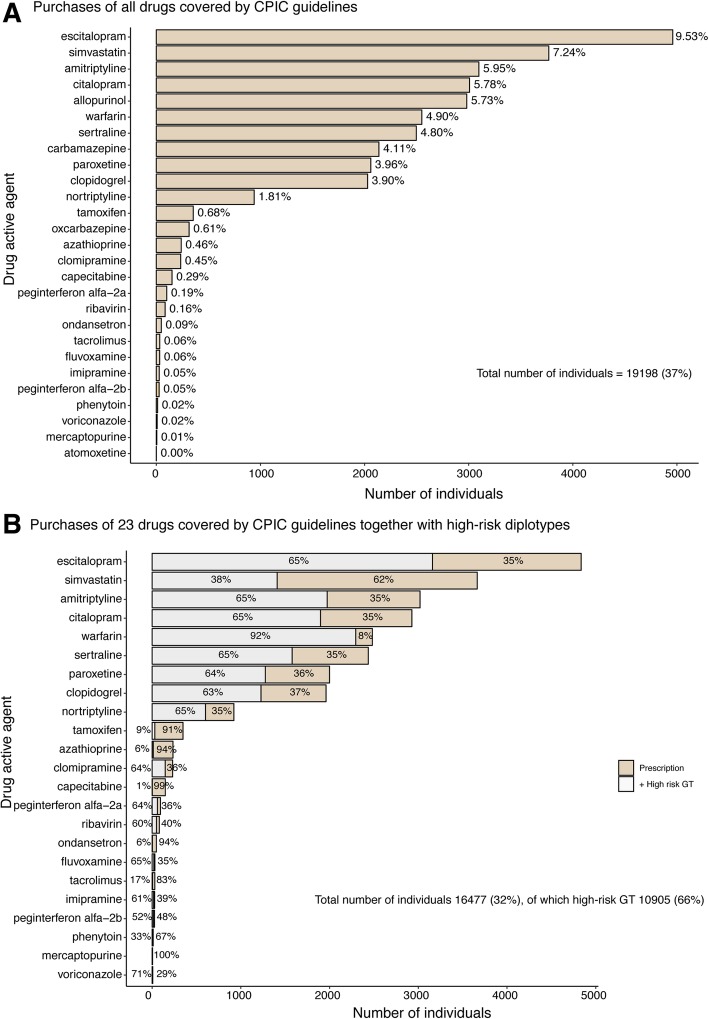
Fig. 2.
Purchasing of drugs with CPIC guidelines based on the Electronic health records of 52,000 Estonian biobank participants. a The number of individuals who have purchased at least one drug listed in CPIC guidelines. Percentages are indicating the proportions from the total number of biobank participants (52,062). b The number of individuals with wild-type or normal function genotypes and drug purchases (light gold), and the proportion of individuals with high-risk genotypes (gray) of a gene covered by the CPIC guidelines. Numbers are represented for 23 drugs since the pipeline for calling metabolizing phenotypes was developed for 11 genes [44]

