
Fig. 2.
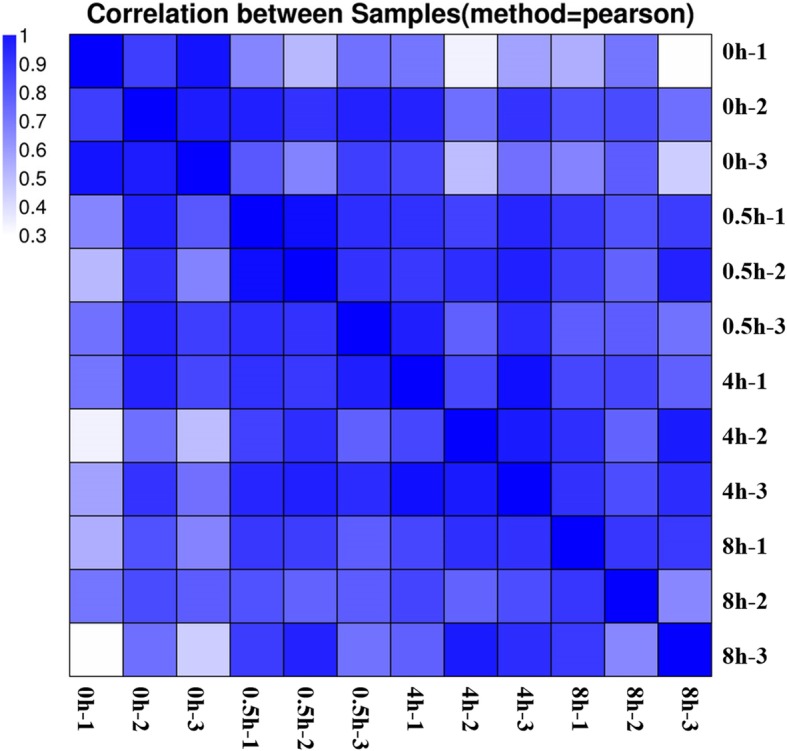
Correlation coefficients for every two samples. Heat map color represents the correlation coefficient; the darker the color, the higher the correlation
Official websites use .gov
A
.gov website belongs to an official
government organization in the United States.
Secure .gov websites use HTTPS
A lock (
) or https:// means you've safely
connected to the .gov website. Share sensitive
information only on official, secure websites.
Correlation coefficients for every two samples. Heat map color represents the correlation coefficient; the darker the color, the higher the correlation