Fig. 1.
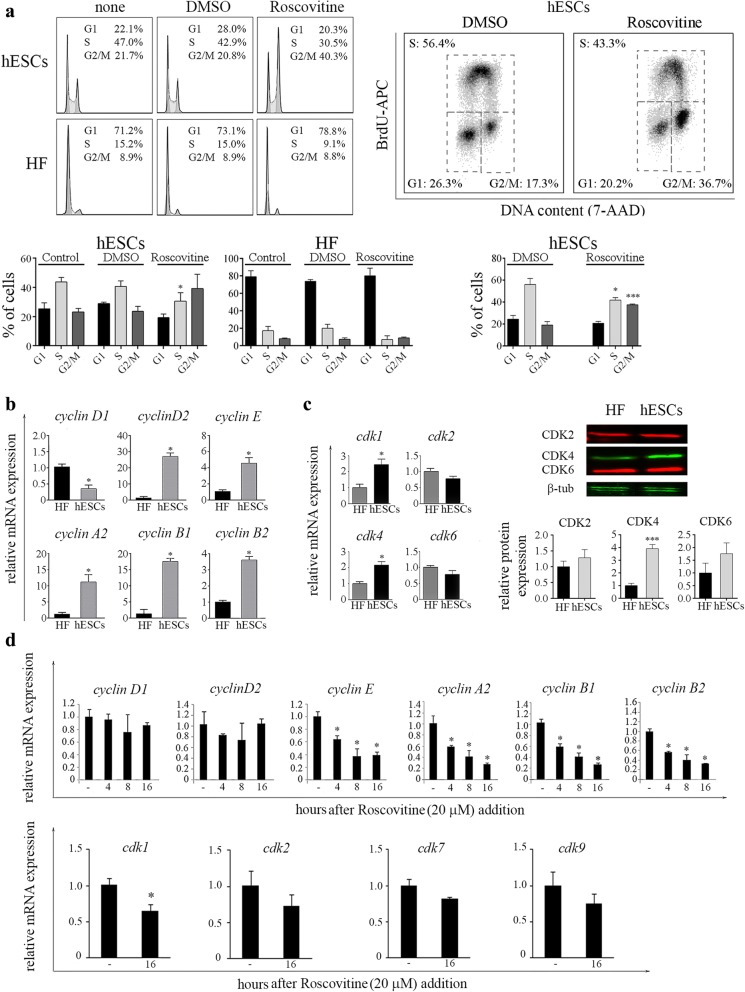
ROSC affects cell cycle distribution and key cell cycle regulators expression. a hESCs were exposed to ROSC or DMSO for 16 h. Cell cycle distribution of asynchronously growing or ROSC-treated H9 and HF was determined by flow cytometry analysis of cellular DNA content following cell staining with PI (left panel). Cells were pulse labeled with BrdU for 30 min prior to harvesting and stained with anti-BrdU-APC conjugate and with7-amino-actinomycin D (7-AAD) for determination of DNA synthesis and DNA content respectively (right panel). Bar graphs summarizing flow cytometry cell cycle profile analysis. Error bars represent means ± SD from three independent experiments (lower panels). b Comparison of mRNA expression levels for cyclin D1, D2, E, A2, B1 and B2 in hESCs and HF assessed by Real Time RT-PCR (left panel). Rpl7expression served as normalizer. Graph shows mRNA fold change relative to HF. The mean ± SEM from three independent experiments are shown. c Comparison of mRNA expression levels of cdk1, cdk2, cdk4 and cdk6 in hESCs and HF analyzed by Real Time RT-PCR (left panel). Representative Western blot images of CDK2, CDK4 and CDK6 (right panel). β-Tubulin served as loading control. Bar graphs show densitometric quantification. Data are expressed as means ± SD (left panel). d Time course analysis of mRNA levels of cyclin D1, D2, E, A2, B1, B2 and cdk1, cdk2, cdk7 and cdk9 were assessed by Real Time RT-PCR in ROSC-treated or untreated hESCs. Rpl7 expression served as normalizer. Graph shows mRNA fold change relative to untreated cells. The mean ± SEM from three independent experiments are shown. In all cases paired Student’s t test was used to test for significant differences *P < 0.05, ***P < 0.001

