Fig. 2.
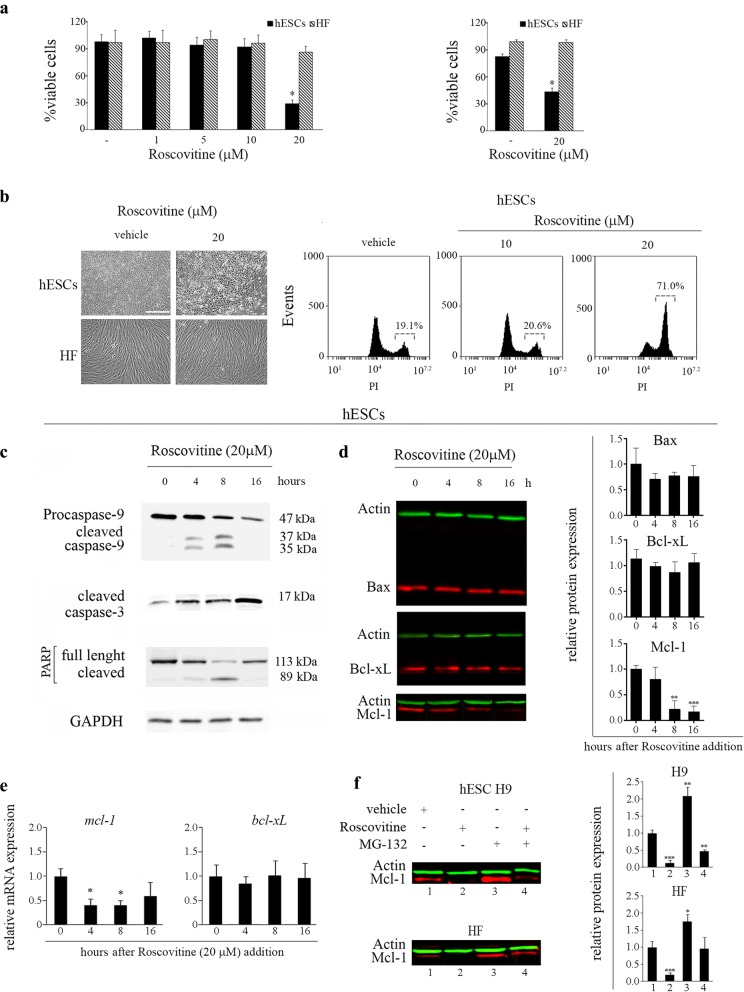
ROSC induces apoptosis in H9 hESC line. a H9 cells and HF were treated with increasing concentrations of ROSC (0–20 μM) over a 16 h period. Cell viability was measured by the XTT/PMS vital dye assay (left panel) and by Trypan blue exclusion method (right panel). Bar graphs show the percentage of viable cells. Each bar represents the mean ± SEM of three independent experiments performed in quadruplicates. b Representative photomicrographs of H9 colonies and HF treated or not with 20 μM ROSC over a 16 h period. The scale bar represents 100 μm (right panel). Representative histograms of PI stained cells exposed or not to ROSC for 16 h. Percentage of PI+ cells was determined by flow cytometric analysis (left panel). c Time course of caspase-9 and caspase-3 activation and PARP cleavage in hESCs upon ROSC treatment was analyzed by Western blotting with anti-caspase-9, anti-active caspase-3 and anti-PARP specific antibodies. GAPDH served as loading control. d Representative Western blot in H9 cells of Bax, Bcl-xL and Mcl-1 at different time points after ROSC addition. Bar graphs show densitometric quantification. Data are expressed as means ± SD (left panel). e A time-course analyses of mcl-1 and bcl-xL mRNA expression levels by Real Time RT-PCR in ROSC-treated or untreated hESCs. Rpl7 expression served as normalizer. Graph shows mRNA fold change relative to untreated cells. Each bar represents the mean ± SEM of three independent experiments. f H9 cells and HF were incubated in the absence or presence of ROSC (20 μM) or MG-132 (5 μM) alone or combined. Mcl-1 level of expression was verified by immunoblotting. Actin served as loading control. Bar graphs show densitometric quantification. A paired Student’s t test was used to compare ROSC-treated samples to untreated controls *P < 0.05, **P < 0.01, ***P < 0.001

