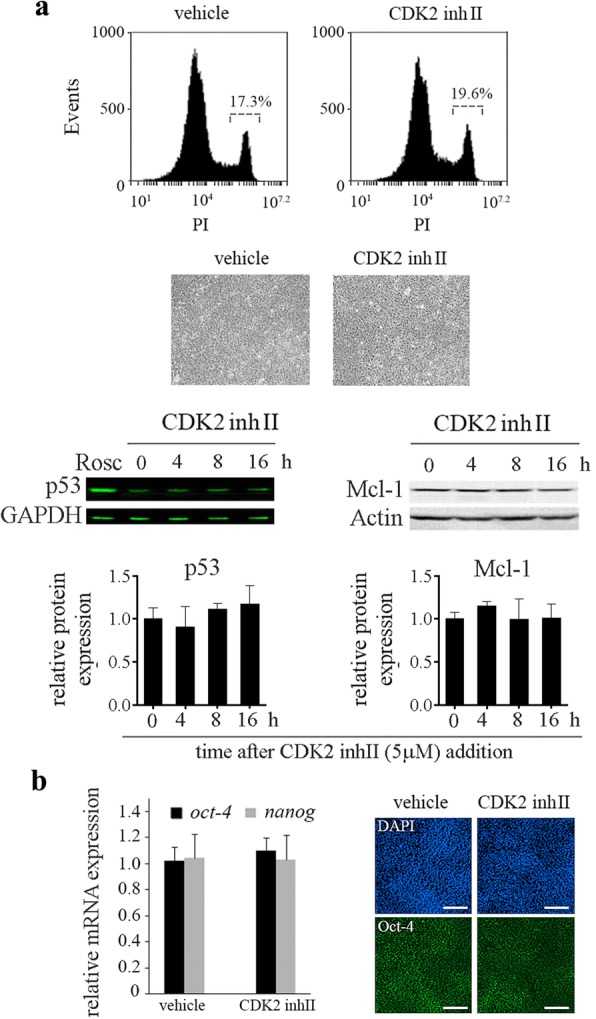
Fig. 5.

Small molecule inhibition of CDK2 did not induce cell death in hESCs. a Representative histograms of PI stained cells exposed or not to CDK2 inhibitor II (5 μM) for 24 h. Percentage of PI+ cells was determined by flow cytometric analysis (top panel). Representative photomicrographs of H9 colonies and HF treated or not with 5 μM CDK2 inhibitor II over a 24 h period (bottom left panel). p53 and Mcl-1protein levels were analyzed in the presence or absence of CDK2 inhibitor by Western blot. GAPDH and Actin were used as loading controls. Bar graphs show densitometric quantification (bottom right panel). b Pluripotency markers oct-4 and nanog mRNA expression levels by Real Time RT-PCR in CDK2 inhibitor II-treated or untreated (vehicle) hESCs. Rpl7 expression was used as normalizer (right panel). The mean ± SEM from three independent experiments are shown. In all cases, a paired Student’s t test was used to test for significant differences between ROSC-treated and untreated samples. *P < 0.05. Immunofluorescence photomicrographs of CDK2 inhibitor II-treated H9 cells (5 μM during 72 h). Representative images of H9 cells stained with primary antibody against Oct-4. Nuclei were counterstained with DAPI. Scale bars represent 100 μm
