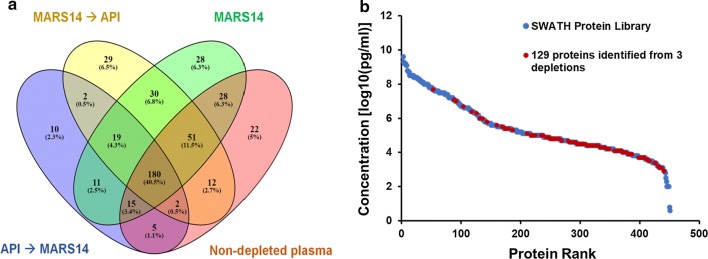
Fig. 3.
Quantifiable plasma proteins found in healthy/CRC plasmas from non-depleted and multiple plasma protein depletion strategies. Venn diagram [43] a showing the numbers of unique and common quantifiable proteins following three depletion (MARS-14, API followed by MARS-14 and MARS-14 followed by API) and non-depletion experiments. Protein concentration range (b) of the additional 129 proteins found after high-medium abundance protein depletion on the plasma SWATH library “Anderson curve”

