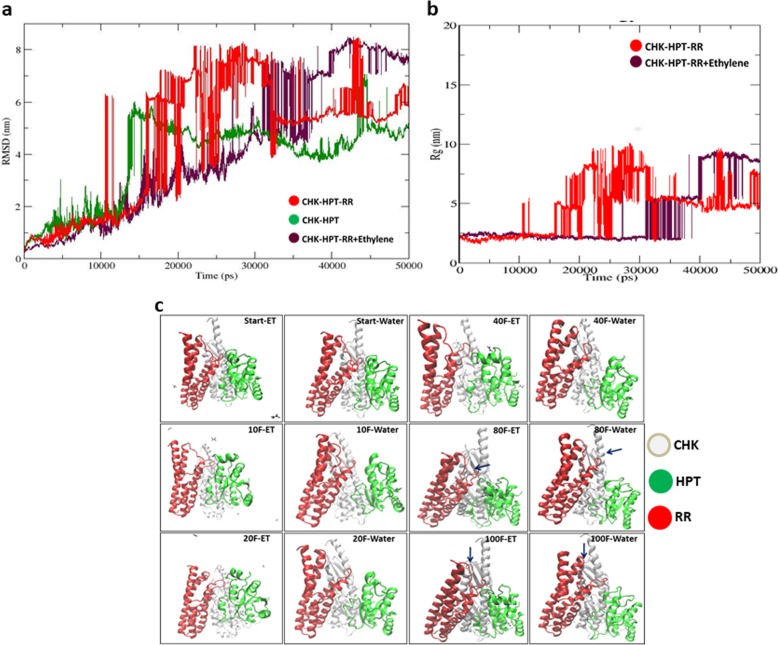
Fig. 5.
Comparative molecular dynamics analysis of TCS protein complex with or without ethylene. a Represents comparison between CHK-HPT + CHK-HPT-RR complex and CHK-HPT-RR + Ethylene complex in their scalar distance between atoms. b Presents comparison between CHK-HPT + CHK-HPT-RR complex and CHK-HPT-RR + Ethylene complex in their structural compactness by their gyration radius. c Structural changes in TCS complex with and without ethylene. Frame wise comparison between CHK-HPT-RR complex and CHK-HPT-RR + Ethylene complex, obtained after 50 ns production MD run, to show the structural changes in protein complex during presence of ethylene and without ethylene. CHK represented by white/silver coloured structure, HPT by green and RR by red. Minute background structures are ethylene

