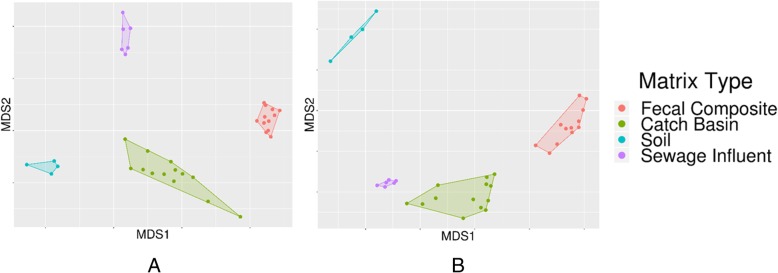
Fig. 3.
Comparative microbiota and resistome compositions of various sample types. Non-metric multidimensional scaling (NMDS) ordination plot indicate microbiota and resistome composition differences between fecal, catch basin, soil and wastewater (SI) samples at (a) genus (ANOSIM P = 0.001, ANOSIM R = 0.9804) and (b) AMR group (ANOSIM P = 0.001, ANOSIM R = 0. 9767) levels

