Fig. 2.

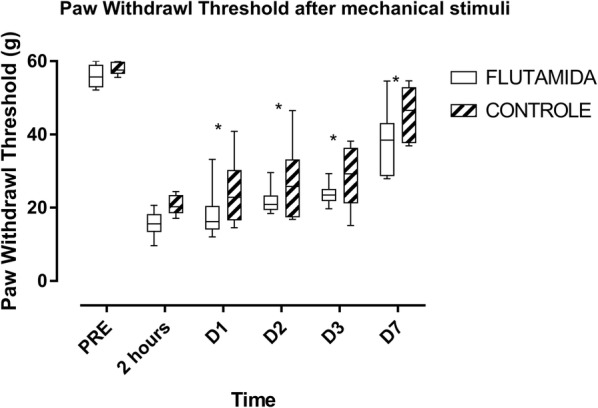
Pattern of the paw withdrawal threshold in Flutamide-treated and Control rats. The data were analyzed using the Mann–Whitney test and are presented as median, lower and upper quartile. *p < 0.05 versus Control group

Pattern of the paw withdrawal threshold in Flutamide-treated and Control rats. The data were analyzed using the Mann–Whitney test and are presented as median, lower and upper quartile. *p < 0.05 versus Control group