Fig. 3.

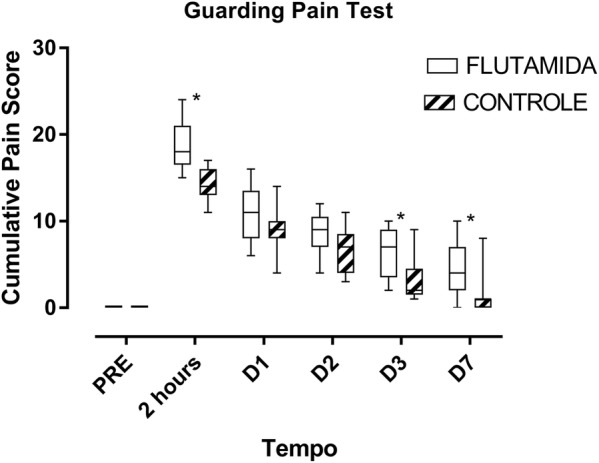
Spontaneous pain represented by Guarding Pain test scores over time for the flutamide-treated and non-treated groups. Data analyzed with the Mann–Whitney test and expressed as median, lower and upper quartile. *p < 0.05 versus Control group

Spontaneous pain represented by Guarding Pain test scores over time for the flutamide-treated and non-treated groups. Data analyzed with the Mann–Whitney test and expressed as median, lower and upper quartile. *p < 0.05 versus Control group