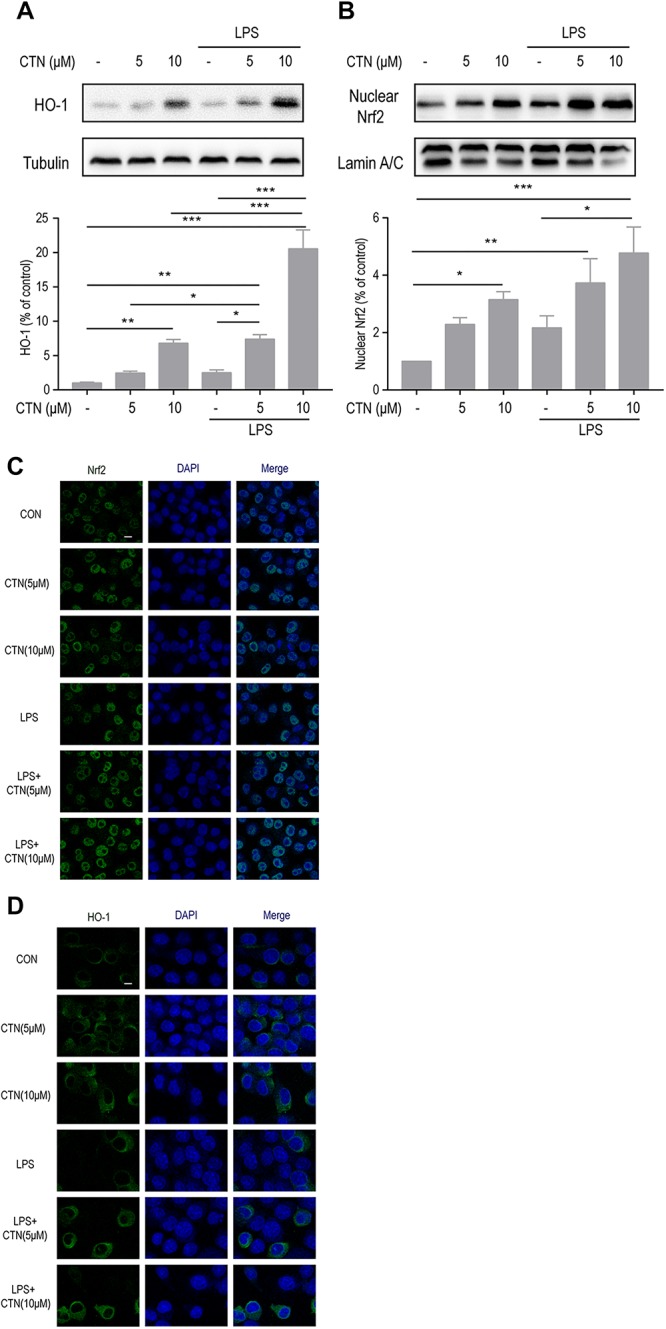
FIGURE 5.

Effect of CTN on LPS-induced expression of Nrf2 and HO-1 in BV2 microglial cells. (A) BV-2 microglial cells were pretreated with CTN at various concentrations for 1 h and subsequently co-treated with 1 μg/ml LPS for 18 h. Ten micromolars of CTN significantly increased the expression of HO-1 in BV-2 microglial cells. LPS did not significantly increased the expression of HO-1, but augmented the increase induced by 5 or 10 μM CTN. Data were presented as mean ± SEM. All experiments were repeated at least three times. ∗P < 0.05, ∗∗P < 0.01, ∗∗∗P < 0.001. (B) BV-2 microglial cells were pretreated with CTN at various concentrations for 1 h and subsequently co-treated with 1 μg/ml LPS for 1 h. Five micromolars of CTN alone did not influence the expression of Nrf2 in BV-2 microglial cells, but 10 μM CTN significantly increased the expression of Nrf2. LPS did not significantly increase the expression of Nrf2, but augmented the increase induced by 5 or 10 μM CTN. (C) Immunofluorescence staining against Nrf2 showing similar results to those in (B). Green is Nrf2 staining, blue is DAPI counterstain (magnification, 40×, scale bar: 20 μm). All experiments were repeated at least three times. (D) Immunofluorescence staining against HO-1 showing similar results to those in (A). Green is HO-1 staining, blue is DAPI counterstain (magnification, 40×, scale bar: 20 μm). All experiments were repeated at least three times.
